Immigrants from Congo vs Immigrants from Yemen Disability
COMPARE
Immigrants from Congo
Immigrants from Yemen
Disability
Disability Comparison
Immigrants from Congo
Immigrants from Yemen
12.2%
DISABILITY
1.9/ 100
METRIC RATING
237th/ 347
METRIC RANK
12.6%
DISABILITY
0.1/ 100
METRIC RATING
271st/ 347
METRIC RANK
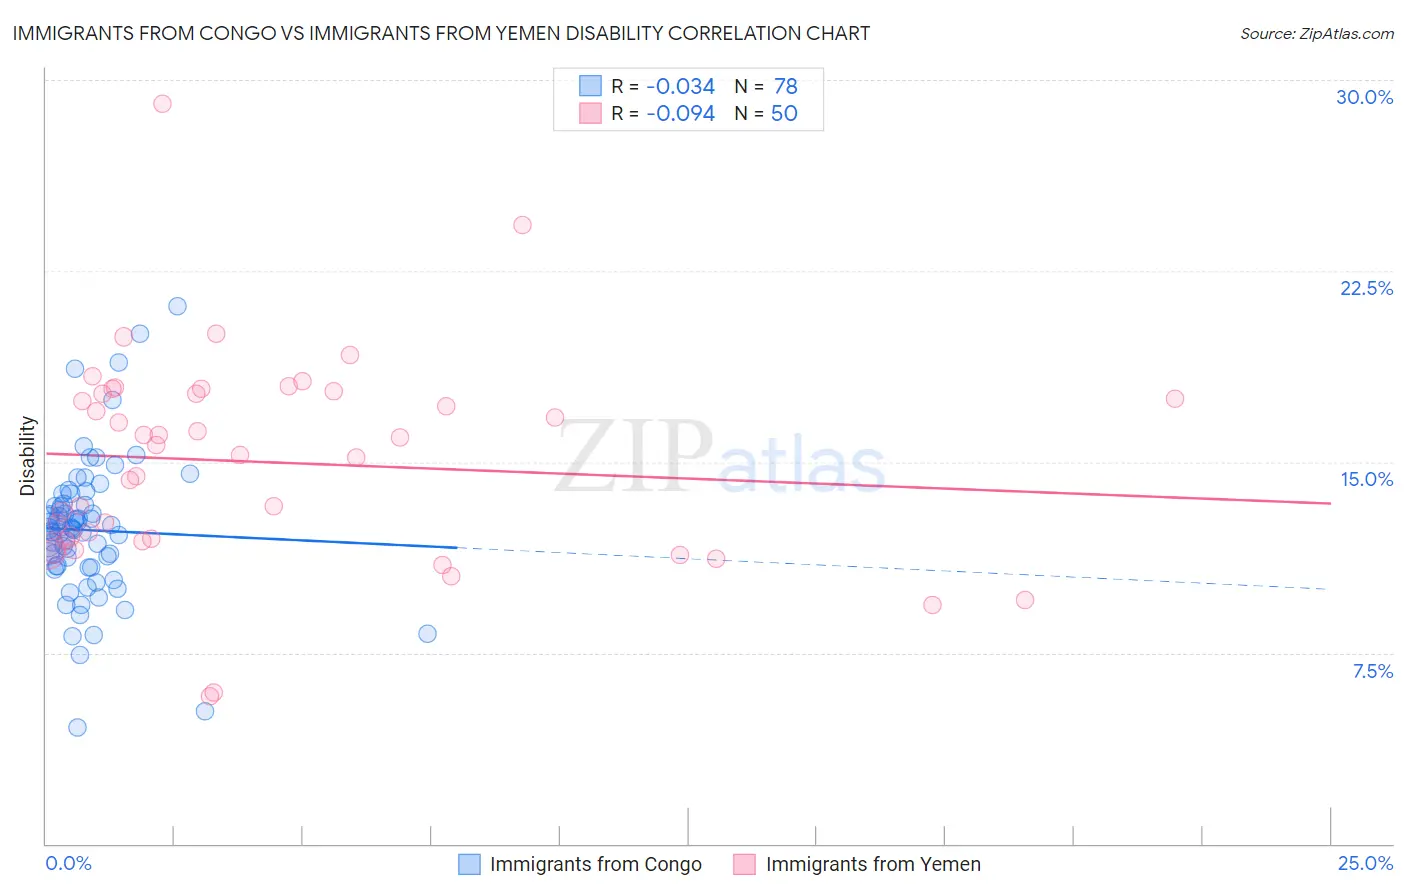
Immigrants from Congo vs Immigrants from Yemen Disability Correlation Chart
The statistical analysis conducted on geographies consisting of 92,123,108 people shows no correlation between the proportion of Immigrants from Congo and percentage of population with a disability in the United States with a correlation coefficient (R) of -0.034 and weighted average of 12.2%. Similarly, the statistical analysis conducted on geographies consisting of 82,432,981 people shows a slight negative correlation between the proportion of Immigrants from Yemen and percentage of population with a disability in the United States with a correlation coefficient (R) of -0.094 and weighted average of 12.6%, a difference of 3.4%.
Disability Correlation Summary
| Measurement | Immigrants from Congo | Immigrants from Yemen |
| Minimum | 4.6% | 5.8% |
| Maximum | 21.1% | 29.1% |
| Range | 16.5% | 23.3% |
| Mean | 12.3% | 15.0% |
| Median | 12.4% | 15.5% |
| Interquartile 25% (IQ1) | 10.9% | 11.9% |
| Interquartile 75% (IQ3) | 13.3% | 17.7% |
| Interquartile Range (IQR) | 2.4% | 5.8% |
| Standard Deviation (Sample) | 2.8% | 4.2% |
| Standard Deviation (Population) | 2.8% | 4.1% |
Similar Demographics by Disability
Demographics Similar to Immigrants from Congo by Disability
In terms of disability, the demographic groups most similar to Immigrants from Congo are Norwegian (12.2%, a difference of 0.040%), Chinese (12.2%, a difference of 0.050%), Swedish (12.2%, a difference of 0.080%), Hungarian (12.2%, a difference of 0.13%), and Yugoslavian (12.2%, a difference of 0.13%).
| Demographics | Rating | Rank | Disability |
| Samoans | 2.6 /100 | #230 | Tragic 12.2% |
| Malaysians | 2.5 /100 | #231 | Tragic 12.2% |
| Italians | 2.5 /100 | #232 | Tragic 12.2% |
| Bahamians | 2.3 /100 | #233 | Tragic 12.2% |
| Japanese | 2.3 /100 | #234 | Tragic 12.2% |
| Yup'ik | 2.2 /100 | #235 | Tragic 12.2% |
| Chinese | 2.0 /100 | #236 | Tragic 12.2% |
| Immigrants | Congo | 1.9 /100 | #237 | Tragic 12.2% |
| Norwegians | 1.9 /100 | #238 | Tragic 12.2% |
| Swedes | 1.8 /100 | #239 | Tragic 12.2% |
| Hungarians | 1.7 /100 | #240 | Tragic 12.2% |
| Yugoslavians | 1.7 /100 | #241 | Tragic 12.2% |
| Poles | 1.7 /100 | #242 | Tragic 12.2% |
| British | 1.5 /100 | #243 | Tragic 12.2% |
| Basques | 1.5 /100 | #244 | Tragic 12.2% |
Demographics Similar to Immigrants from Yemen by Disability
In terms of disability, the demographic groups most similar to Immigrants from Yemen are Portuguese (12.6%, a difference of 0.050%), Immigrants from Dominican Republic (12.6%, a difference of 0.44%), Dominican (12.7%, a difference of 0.49%), Bangladeshi (12.6%, a difference of 0.53%), and Finnish (12.7%, a difference of 0.66%).
| Demographics | Rating | Rank | Disability |
| Immigrants | Germany | 0.2 /100 | #264 | Tragic 12.5% |
| U.S. Virgin Islanders | 0.2 /100 | #265 | Tragic 12.5% |
| Czechoslovakians | 0.2 /100 | #266 | Tragic 12.5% |
| Spaniards | 0.2 /100 | #267 | Tragic 12.5% |
| Bangladeshis | 0.1 /100 | #268 | Tragic 12.6% |
| Immigrants | Dominican Republic | 0.1 /100 | #269 | Tragic 12.6% |
| Portuguese | 0.1 /100 | #270 | Tragic 12.6% |
| Immigrants | Yemen | 0.1 /100 | #271 | Tragic 12.6% |
| Dominicans | 0.0 /100 | #272 | Tragic 12.7% |
| Finns | 0.0 /100 | #273 | Tragic 12.7% |
| Nepalese | 0.0 /100 | #274 | Tragic 12.8% |
| Sioux | 0.0 /100 | #275 | Tragic 12.8% |
| Hmong | 0.0 /100 | #276 | Tragic 12.8% |
| Dutch | 0.0 /100 | #277 | Tragic 12.8% |
| Germans | 0.0 /100 | #278 | Tragic 12.8% |