Immigrants from Congo vs Immigrants from Liberia Disability
COMPARE
Immigrants from Congo
Immigrants from Liberia
Disability
Disability Comparison
Immigrants from Congo
Immigrants from Liberia
12.2%
DISABILITY
1.9/ 100
METRIC RATING
237th/ 347
METRIC RANK
12.4%
DISABILITY
0.4/ 100
METRIC RATING
260th/ 347
METRIC RANK
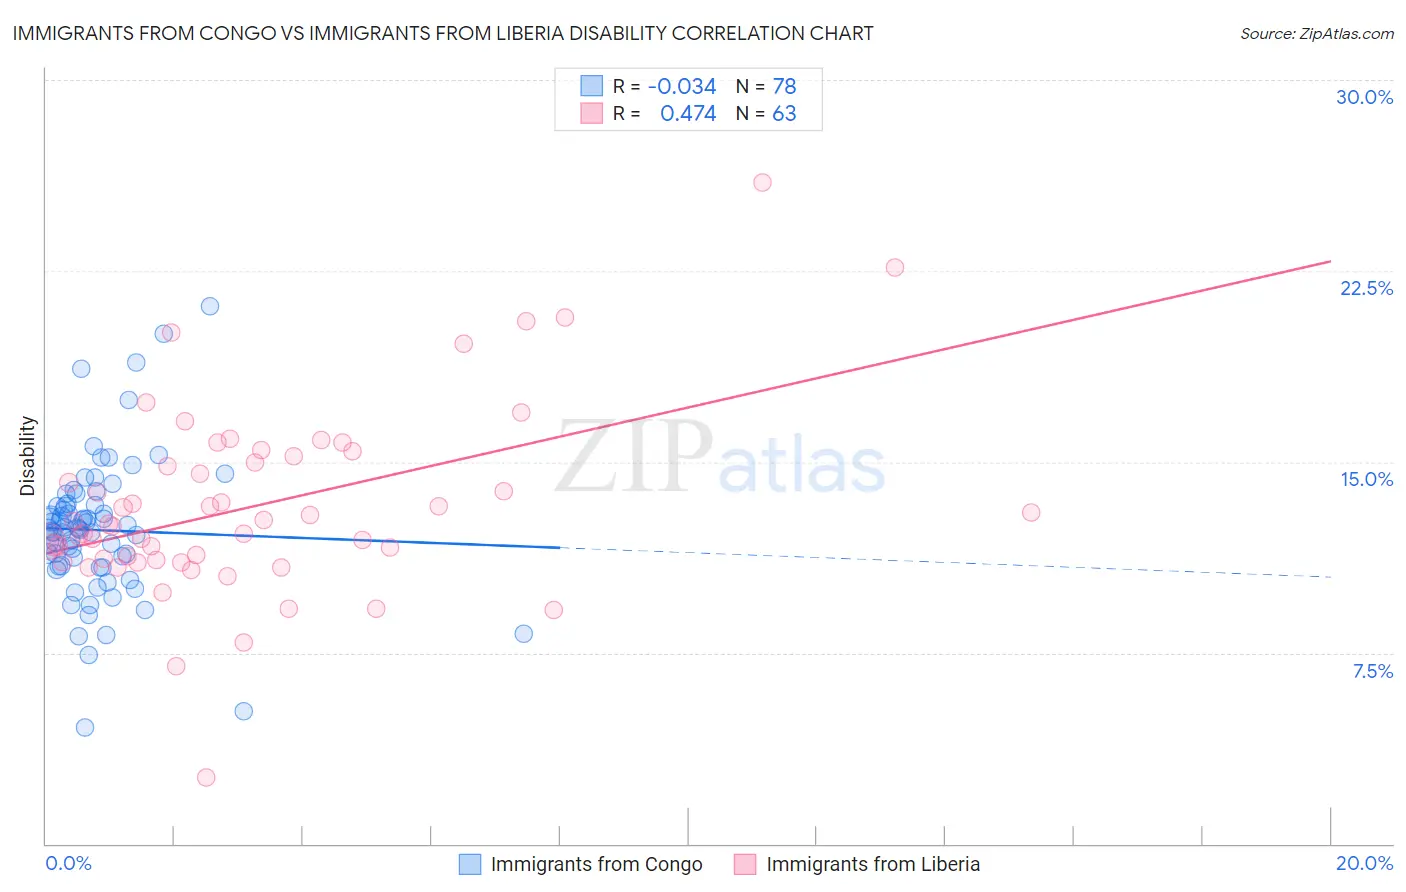
Immigrants from Congo vs Immigrants from Liberia Disability Correlation Chart
The statistical analysis conducted on geographies consisting of 92,123,108 people shows no correlation between the proportion of Immigrants from Congo and percentage of population with a disability in the United States with a correlation coefficient (R) of -0.034 and weighted average of 12.2%. Similarly, the statistical analysis conducted on geographies consisting of 135,259,590 people shows a moderate positive correlation between the proportion of Immigrants from Liberia and percentage of population with a disability in the United States with a correlation coefficient (R) of 0.474 and weighted average of 12.4%, a difference of 1.6%.
Disability Correlation Summary
| Measurement | Immigrants from Congo | Immigrants from Liberia |
| Minimum | 4.6% | 2.6% |
| Maximum | 21.1% | 26.0% |
| Range | 16.5% | 23.4% |
| Mean | 12.3% | 13.3% |
| Median | 12.4% | 12.5% |
| Interquartile 25% (IQ1) | 10.9% | 11.2% |
| Interquartile 75% (IQ3) | 13.3% | 15.2% |
| Interquartile Range (IQR) | 2.4% | 4.1% |
| Standard Deviation (Sample) | 2.8% | 3.7% |
| Standard Deviation (Population) | 2.8% | 3.7% |
Similar Demographics by Disability
Demographics Similar to Immigrants from Congo by Disability
In terms of disability, the demographic groups most similar to Immigrants from Congo are Norwegian (12.2%, a difference of 0.040%), Chinese (12.2%, a difference of 0.050%), Swedish (12.2%, a difference of 0.080%), Hungarian (12.2%, a difference of 0.13%), and Yugoslavian (12.2%, a difference of 0.13%).
| Demographics | Rating | Rank | Disability |
| Samoans | 2.6 /100 | #230 | Tragic 12.2% |
| Malaysians | 2.5 /100 | #231 | Tragic 12.2% |
| Italians | 2.5 /100 | #232 | Tragic 12.2% |
| Bahamians | 2.3 /100 | #233 | Tragic 12.2% |
| Japanese | 2.3 /100 | #234 | Tragic 12.2% |
| Yup'ik | 2.2 /100 | #235 | Tragic 12.2% |
| Chinese | 2.0 /100 | #236 | Tragic 12.2% |
| Immigrants | Congo | 1.9 /100 | #237 | Tragic 12.2% |
| Norwegians | 1.9 /100 | #238 | Tragic 12.2% |
| Swedes | 1.8 /100 | #239 | Tragic 12.2% |
| Hungarians | 1.7 /100 | #240 | Tragic 12.2% |
| Yugoslavians | 1.7 /100 | #241 | Tragic 12.2% |
| Poles | 1.7 /100 | #242 | Tragic 12.2% |
| British | 1.5 /100 | #243 | Tragic 12.2% |
| Basques | 1.5 /100 | #244 | Tragic 12.2% |
Demographics Similar to Immigrants from Liberia by Disability
In terms of disability, the demographic groups most similar to Immigrants from Liberia are Canadian (12.4%, a difference of 0.030%), Scandinavian (12.4%, a difference of 0.070%), Slavic (12.4%, a difference of 0.090%), Immigrants from Laos (12.4%, a difference of 0.23%), and Immigrants from Dominica (12.4%, a difference of 0.32%).
| Demographics | Rating | Rank | Disability |
| Belgians | 0.8 /100 | #253 | Tragic 12.3% |
| German Russians | 0.8 /100 | #254 | Tragic 12.3% |
| Slovenes | 0.6 /100 | #255 | Tragic 12.4% |
| Immigrants | Dominica | 0.6 /100 | #256 | Tragic 12.4% |
| Immigrants | Laos | 0.5 /100 | #257 | Tragic 12.4% |
| Slavs | 0.5 /100 | #258 | Tragic 12.4% |
| Canadians | 0.4 /100 | #259 | Tragic 12.4% |
| Immigrants | Liberia | 0.4 /100 | #260 | Tragic 12.4% |
| Scandinavians | 0.4 /100 | #261 | Tragic 12.4% |
| Native Hawaiians | 0.3 /100 | #262 | Tragic 12.5% |
| Hawaiians | 0.2 /100 | #263 | Tragic 12.5% |
| Immigrants | Germany | 0.2 /100 | #264 | Tragic 12.5% |
| U.S. Virgin Islanders | 0.2 /100 | #265 | Tragic 12.5% |
| Czechoslovakians | 0.2 /100 | #266 | Tragic 12.5% |
| Spaniards | 0.2 /100 | #267 | Tragic 12.5% |