Immigrants from Congo vs Venezuelan Disability
COMPARE
Immigrants from Congo
Venezuelan
Disability
Disability Comparison
Immigrants from Congo
Venezuelans
12.2%
DISABILITY
1.9/ 100
METRIC RATING
237th/ 347
METRIC RANK
10.5%
DISABILITY
100.0/ 100
METRIC RATING
24th/ 347
METRIC RANK
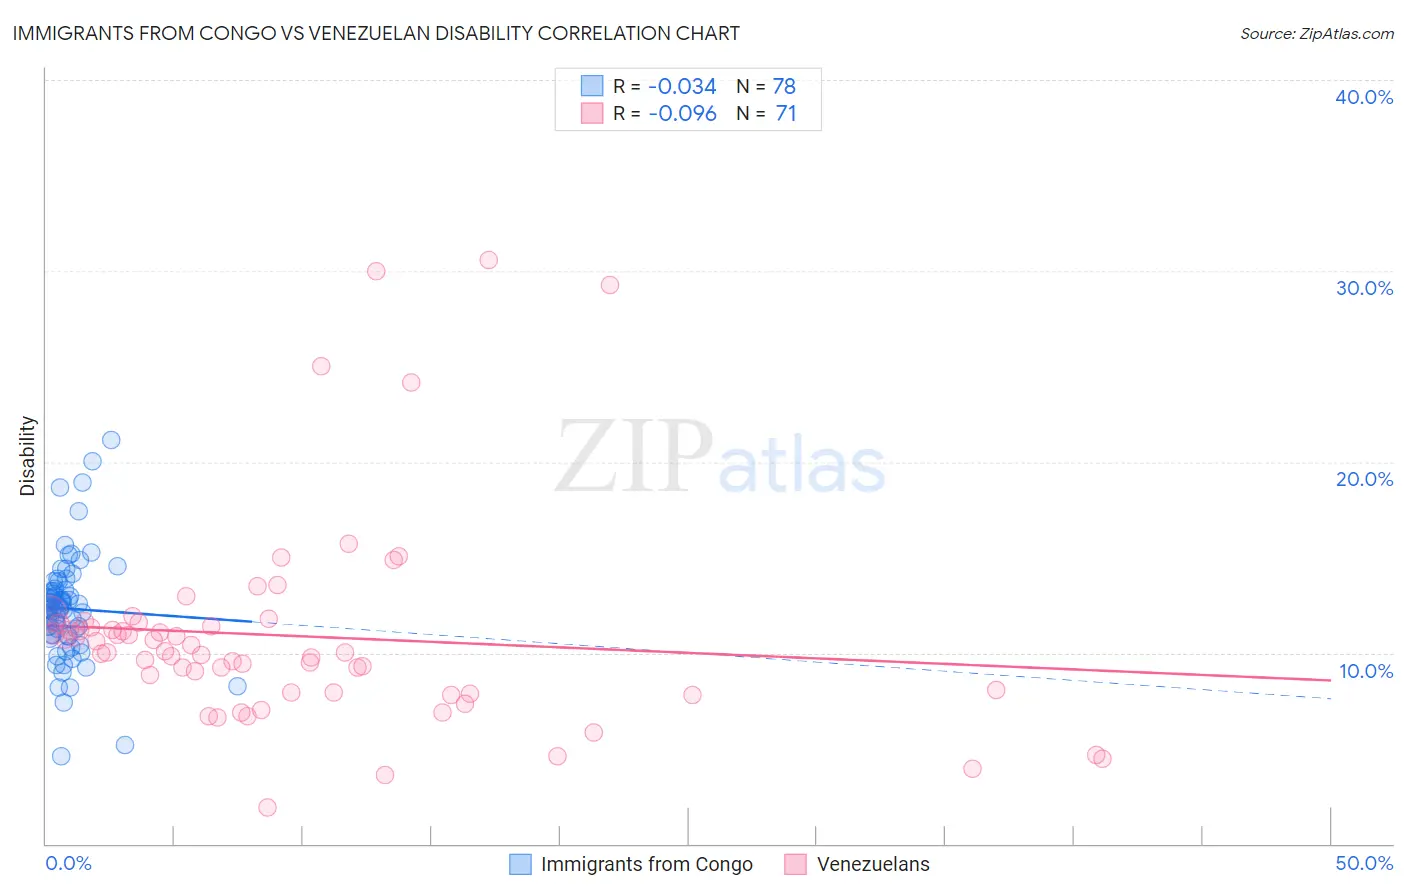
Immigrants from Congo vs Venezuelan Disability Correlation Chart
The statistical analysis conducted on geographies consisting of 92,123,108 people shows no correlation between the proportion of Immigrants from Congo and percentage of population with a disability in the United States with a correlation coefficient (R) of -0.034 and weighted average of 12.2%. Similarly, the statistical analysis conducted on geographies consisting of 306,306,571 people shows a slight negative correlation between the proportion of Venezuelans and percentage of population with a disability in the United States with a correlation coefficient (R) of -0.096 and weighted average of 10.5%, a difference of 15.8%.
Disability Correlation Summary
| Measurement | Immigrants from Congo | Venezuelan |
| Minimum | 4.6% | 1.9% |
| Maximum | 21.1% | 30.5% |
| Range | 16.5% | 28.6% |
| Mean | 12.3% | 10.9% |
| Median | 12.4% | 10.0% |
| Interquartile 25% (IQ1) | 10.9% | 7.9% |
| Interquartile 75% (IQ3) | 13.3% | 11.5% |
| Interquartile Range (IQR) | 2.4% | 3.6% |
| Standard Deviation (Sample) | 2.8% | 5.5% |
| Standard Deviation (Population) | 2.8% | 5.4% |
Similar Demographics by Disability
Demographics Similar to Immigrants from Congo by Disability
In terms of disability, the demographic groups most similar to Immigrants from Congo are Norwegian (12.2%, a difference of 0.040%), Chinese (12.2%, a difference of 0.050%), Swedish (12.2%, a difference of 0.080%), Hungarian (12.2%, a difference of 0.13%), and Yugoslavian (12.2%, a difference of 0.13%).
| Demographics | Rating | Rank | Disability |
| Samoans | 2.6 /100 | #230 | Tragic 12.2% |
| Malaysians | 2.5 /100 | #231 | Tragic 12.2% |
| Italians | 2.5 /100 | #232 | Tragic 12.2% |
| Bahamians | 2.3 /100 | #233 | Tragic 12.2% |
| Japanese | 2.3 /100 | #234 | Tragic 12.2% |
| Yup'ik | 2.2 /100 | #235 | Tragic 12.2% |
| Chinese | 2.0 /100 | #236 | Tragic 12.2% |
| Immigrants | Congo | 1.9 /100 | #237 | Tragic 12.2% |
| Norwegians | 1.9 /100 | #238 | Tragic 12.2% |
| Swedes | 1.8 /100 | #239 | Tragic 12.2% |
| Hungarians | 1.7 /100 | #240 | Tragic 12.2% |
| Yugoslavians | 1.7 /100 | #241 | Tragic 12.2% |
| Poles | 1.7 /100 | #242 | Tragic 12.2% |
| British | 1.5 /100 | #243 | Tragic 12.2% |
| Basques | 1.5 /100 | #244 | Tragic 12.2% |
Demographics Similar to Venezuelans by Disability
In terms of disability, the demographic groups most similar to Venezuelans are Immigrants from Asia (10.5%, a difference of 0.14%), Immigrants from Malaysia (10.6%, a difference of 0.38%), Argentinean (10.6%, a difference of 0.43%), Cypriot (10.6%, a difference of 0.44%), and Egyptian (10.6%, a difference of 0.57%).
| Demographics | Rating | Rank | Disability |
| Immigrants | Iran | 100.0 /100 | #17 | Exceptional 10.3% |
| Burmese | 100.0 /100 | #18 | Exceptional 10.4% |
| Immigrants | Pakistan | 100.0 /100 | #19 | Exceptional 10.4% |
| Immigrants | Venezuela | 100.0 /100 | #20 | Exceptional 10.4% |
| Asians | 100.0 /100 | #21 | Exceptional 10.4% |
| Immigrants | Sri Lanka | 100.0 /100 | #22 | Exceptional 10.5% |
| Immigrants | Asia | 100.0 /100 | #23 | Exceptional 10.5% |
| Venezuelans | 100.0 /100 | #24 | Exceptional 10.5% |
| Immigrants | Malaysia | 100.0 /100 | #25 | Exceptional 10.6% |
| Argentineans | 100.0 /100 | #26 | Exceptional 10.6% |
| Cypriots | 100.0 /100 | #27 | Exceptional 10.6% |
| Egyptians | 100.0 /100 | #28 | Exceptional 10.6% |
| Immigrants | Argentina | 100.0 /100 | #29 | Exceptional 10.6% |
| Immigrants | Turkey | 100.0 /100 | #30 | Exceptional 10.6% |
| Immigrants | Egypt | 100.0 /100 | #31 | Exceptional 10.6% |