Immigrants from Guatemala vs Subsaharan African Disability
COMPARE
Immigrants from Guatemala
Subsaharan African
Disability
Disability Comparison
Immigrants from Guatemala
Sub-Saharan Africans
11.6%
DISABILITY
71.1/ 100
METRIC RATING
154th/ 347
METRIC RANK
12.3%
DISABILITY
1.4/ 100
METRIC RATING
250th/ 347
METRIC RANK
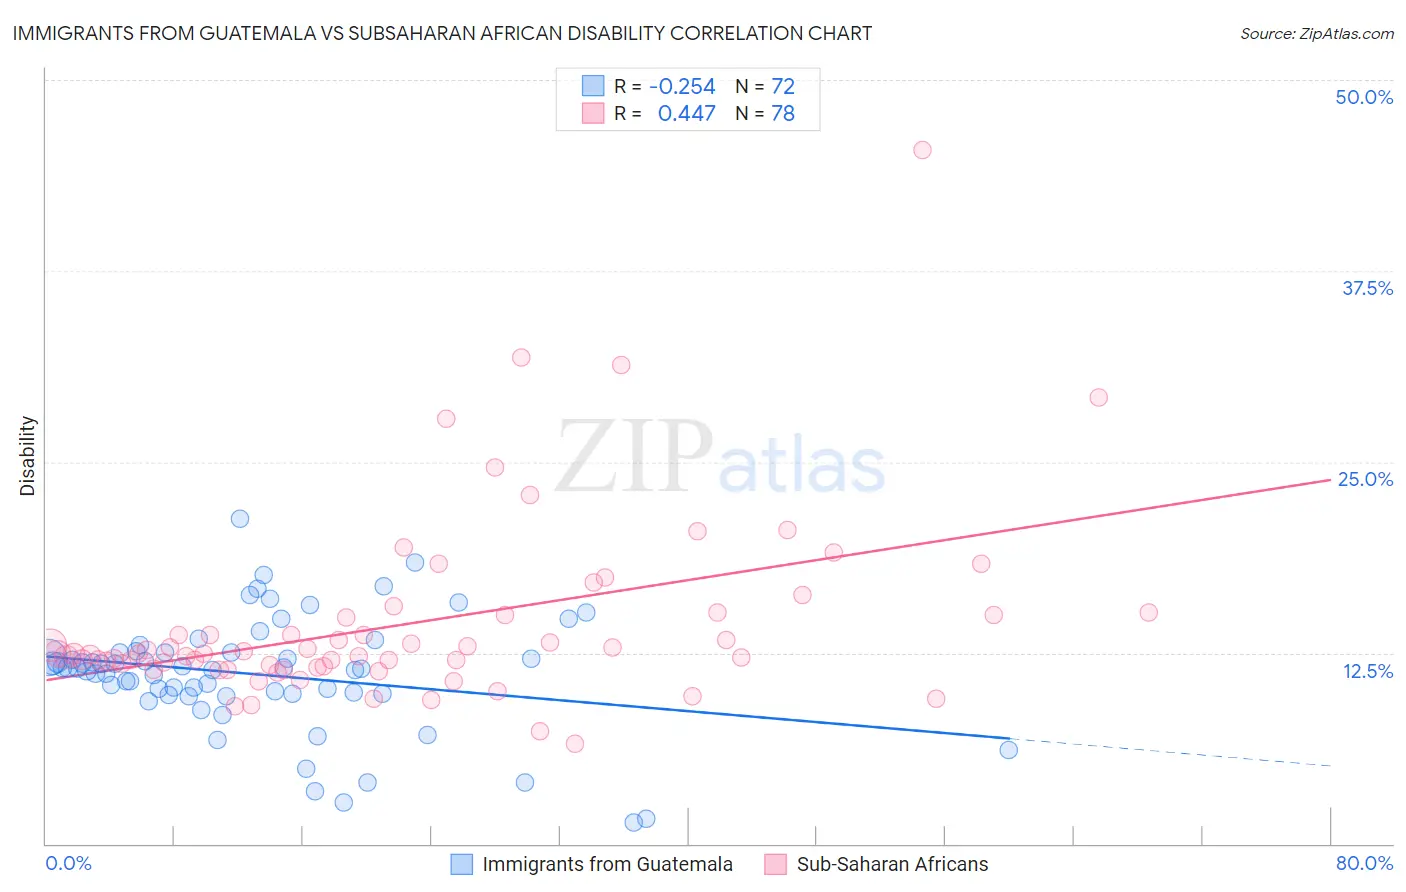
Immigrants from Guatemala vs Subsaharan African Disability Correlation Chart
The statistical analysis conducted on geographies consisting of 377,234,286 people shows a weak negative correlation between the proportion of Immigrants from Guatemala and percentage of population with a disability in the United States with a correlation coefficient (R) of -0.254 and weighted average of 11.6%. Similarly, the statistical analysis conducted on geographies consisting of 508,103,774 people shows a moderate positive correlation between the proportion of Sub-Saharan Africans and percentage of population with a disability in the United States with a correlation coefficient (R) of 0.447 and weighted average of 12.3%, a difference of 5.8%.
Disability Correlation Summary
| Measurement | Immigrants from Guatemala | Subsaharan African |
| Minimum | 1.4% | 6.6% |
| Maximum | 21.3% | 45.5% |
| Range | 19.8% | 38.9% |
| Mean | 11.1% | 14.4% |
| Median | 11.5% | 12.4% |
| Interquartile 25% (IQ1) | 9.8% | 11.6% |
| Interquartile 75% (IQ3) | 12.5% | 14.9% |
| Interquartile Range (IQR) | 2.7% | 3.3% |
| Standard Deviation (Sample) | 3.8% | 6.1% |
| Standard Deviation (Population) | 3.7% | 6.0% |
Similar Demographics by Disability
Demographics Similar to Immigrants from Guatemala by Disability
In terms of disability, the demographic groups most similar to Immigrants from Guatemala are Immigrants from Ghana (11.6%, a difference of 0.0%), Immigrants from Kenya (11.6%, a difference of 0.050%), Immigrants from Moldova (11.6%, a difference of 0.050%), Immigrants from Netherlands (11.6%, a difference of 0.070%), and Romanian (11.6%, a difference of 0.080%).
| Demographics | Rating | Rank | Disability |
| Immigrants | Ukraine | 77.6 /100 | #147 | Good 11.5% |
| Sudanese | 77.1 /100 | #148 | Good 11.5% |
| Immigrants | Norway | 73.2 /100 | #149 | Good 11.6% |
| Romanians | 72.7 /100 | #150 | Good 11.6% |
| Immigrants | Kenya | 72.1 /100 | #151 | Good 11.6% |
| Immigrants | Moldova | 72.0 /100 | #152 | Good 11.6% |
| Immigrants | Ghana | 71.2 /100 | #153 | Good 11.6% |
| Immigrants | Guatemala | 71.1 /100 | #154 | Good 11.6% |
| Immigrants | Netherlands | 69.8 /100 | #155 | Good 11.6% |
| Immigrants | Fiji | 69.5 /100 | #156 | Good 11.6% |
| Immigrants | Middle Africa | 69.5 /100 | #157 | Good 11.6% |
| Armenians | 65.9 /100 | #158 | Good 11.6% |
| Guatemalans | 65.1 /100 | #159 | Good 11.6% |
| Immigrants | Barbados | 64.2 /100 | #160 | Good 11.6% |
| Immigrants | Cuba | 62.8 /100 | #161 | Good 11.6% |
Demographics Similar to Sub-Saharan Africans by Disability
In terms of disability, the demographic groups most similar to Sub-Saharan Africans are European (12.3%, a difference of 0.0%), Carpatho Rusyn (12.3%, a difference of 0.010%), Guamanian/Chamorro (12.3%, a difference of 0.020%), Indonesian (12.2%, a difference of 0.060%), and Swiss (12.2%, a difference of 0.090%).
| Demographics | Rating | Rank | Disability |
| British | 1.5 /100 | #243 | Tragic 12.2% |
| Basques | 1.5 /100 | #244 | Tragic 12.2% |
| Liberians | 1.5 /100 | #245 | Tragic 12.2% |
| Swiss | 1.5 /100 | #246 | Tragic 12.2% |
| Indonesians | 1.4 /100 | #247 | Tragic 12.2% |
| Guamanians/Chamorros | 1.4 /100 | #248 | Tragic 12.3% |
| Carpatho Rusyns | 1.4 /100 | #249 | Tragic 12.3% |
| Sub-Saharan Africans | 1.4 /100 | #250 | Tragic 12.3% |
| Europeans | 1.4 /100 | #251 | Tragic 12.3% |
| Bermudans | 1.1 /100 | #252 | Tragic 12.3% |
| Belgians | 0.8 /100 | #253 | Tragic 12.3% |
| German Russians | 0.8 /100 | #254 | Tragic 12.3% |
| Slovenes | 0.6 /100 | #255 | Tragic 12.4% |
| Immigrants | Dominica | 0.6 /100 | #256 | Tragic 12.4% |
| Immigrants | Laos | 0.5 /100 | #257 | Tragic 12.4% |