Immigrants from Congo vs Immigrants from Switzerland Disability

COMPARE

Immigrants from Congo
Race
Ancestry
AfghanAfricanAlaska NativeAlaskan AthabascanAlbanianAleutAlsatianAmericanApacheArabArapahoArgentineanArmenianAssyrian/Chaldean/SyriacAustralianAustrianBahamianBangladeshiBarbadianBasqueBelgianBelizeanBermudanBhutaneseBlackfeetBolivianBrazilianBritishBritish West IndianBulgarianBurmeseCajunCambodianCanadianCape VerdeanCarpatho RusynCelticCentral AmericanCentral American IndianCherokeeCheyenneChickasawChileanChineseChippewaChoctawColombianColvilleComancheCosta RicanCreeCreekCroatianCrowCubanCypriotCzechCzechoslovakianDanishDelawareDominicanDutchDutch West IndianEastern EuropeanEcuadorianEgyptianEnglishEstonianEthiopianEuropeanFijianFilipinoFinnishFrenchFrench American IndianFrench CanadianGermanGerman RussianGhanaianGreekGuamanian/ChamorroGuatemalanGuyaneseHaitianHmongHonduranHopiHoumaHungarianIcelanderIndian (Asian)IndonesianInupiatIranianIraqiIrishIroquoisIsraeliItalianJamaicanJapaneseJordanianKenyanKiowaKoreanLaotianLatvianLebaneseLiberianLithuanianLumbeeLuxembourgerMacedonianMalaysianMalteseMarshalleseMenomineeMexicanMexican American IndianMongolianMoroccanNative HawaiianNavajoNepaleseNew ZealanderNicaraguanNigerianNorthern EuropeanNorwegianOkinawanOsageOttawaPaiutePakistaniPalestinianPanamanianParaguayanPennsylvania GermanPeruvianPimaPolishPortuguesePotawatomiPuebloPuerto RicanPuget Sound SalishRomanianRussianSalvadoranSamoanScandinavianScotch-IrishScottishSeminoleSenegaleseSerbianShoshoneSierra LeoneanSiouxSlavicSlovakSloveneSomaliSouth AfricanSouth AmericanSouth American IndianSoviet UnionSpaniardSpanishSpanish AmericanSpanish American IndianSri LankanSubsaharan AfricanSudaneseSwedishSwissSyrianTaiwaneseThaiTlingit-HaidaTohono O'OdhamTonganTrinidadian and TobagonianTsimshianTurkishU.S. Virgin IslanderUgandanUkrainianUruguayanUteVenezuelanVietnameseWelshWest IndianYakamaYaquiYugoslavianYumanYup'ikZimbabwean
Immigration
NonimmigrantsImmigrantsAfghanistanAfricaAlbaniaArgentinaArmeniaAsiaAustraliaAustriaBahamasBangladeshBarbadosBelarusBelgiumBelizeBoliviaBosnia and HerzegovinaBrazilBulgariaBurma/MyanmarCabo VerdeCambodiaCameroonCanadaCaribbeanCentral AmericaChileChinaColombiaCongoCosta RicaCroatiaCubaCzechoslovakiaDenmarkDominicaDominican RepublicEastern AfricaEastern AsiaEastern EuropeEcuadorEgyptEl SalvadorEnglandEritreaEthiopiaEuropeFijiFranceGermanyGhanaGreeceGrenadaGuatemalaGuyanaHaitiHondurasHong KongHungaryIndiaIndonesiaIranIraqIrelandIsraelItalyJamaicaJapanJordanKazakhstanKenyaKoreaKuwaitLaosLatin AmericaLatviaLebanonLiberiaLithuaniaMalaysiaMexicoMicronesiaMiddle AfricaMoldovaMoroccoNepalNetherlandsNicaraguaNigeriaNorth AmericaNorth MacedoniaNorthern AfricaNorthern EuropeNorwayOceaniaPakistanPanamaPeruPhilippinesPolandPortugalRomaniaRussiaSaudi ArabiaScotlandSenegalSerbiaSierra LeoneSingaporeSomaliaSouth AfricaSouth AmericaSouth Central AsiaSouth Eastern AsiaSouthern EuropeSpainSri LankaSt. Vincent and the GrenadinesSudanSwedenSyriaTaiwanThailandTrinidad and TobagoTurkeyUgandaUkraineUruguayUzbekistanVenezuelaVietnamWest IndiesWestern AfricaWestern AsiaWestern EuropeYemenZaireZimbabweAzores
Immigrants from Switzerland
Race
Ancestry
AfghanAfricanAlaska NativeAlaskan AthabascanAlbanianAleutAlsatianAmericanApacheArabArapahoArgentineanArmenianAssyrian/Chaldean/SyriacAustralianAustrianBahamianBangladeshiBarbadianBasqueBelgianBelizeanBermudanBhutaneseBlackfeetBolivianBrazilianBritishBritish West IndianBulgarianBurmeseCajunCambodianCanadianCape VerdeanCarpatho RusynCelticCentral AmericanCentral American IndianCherokeeCheyenneChickasawChileanChineseChippewaChoctawColombianColvilleComancheCosta RicanCreeCreekCroatianCrowCubanCypriotCzechCzechoslovakianDanishDelawareDominicanDutchDutch West IndianEastern EuropeanEcuadorianEgyptianEnglishEstonianEthiopianEuropeanFijianFilipinoFinnishFrenchFrench American IndianFrench CanadianGermanGerman RussianGhanaianGreekGuamanian/ChamorroGuatemalanGuyaneseHaitianHmongHonduranHopiHoumaHungarianIcelanderIndian (Asian)IndonesianInupiatIranianIraqiIrishIroquoisIsraeliItalianJamaicanJapaneseJordanianKenyanKiowaKoreanLaotianLatvianLebaneseLiberianLithuanianLumbeeLuxembourgerMacedonianMalaysianMalteseMarshalleseMenomineeMexicanMexican American IndianMongolianMoroccanNative HawaiianNavajoNepaleseNew ZealanderNicaraguanNigerianNorthern EuropeanNorwegianOkinawanOsageOttawaPaiutePakistaniPalestinianPanamanianParaguayanPennsylvania GermanPeruvianPimaPolishPortuguesePotawatomiPuebloPuerto RicanPuget Sound SalishRomanianRussianSalvadoranSamoanScandinavianScotch-IrishScottishSeminoleSenegaleseSerbianShoshoneSierra LeoneanSiouxSlavicSlovakSloveneSomaliSouth AfricanSouth AmericanSouth American IndianSoviet UnionSpaniardSpanishSpanish AmericanSpanish American IndianSri LankanSubsaharan AfricanSudaneseSwedishSwissSyrianTaiwaneseThaiTlingit-HaidaTohono O'OdhamTonganTrinidadian and TobagonianTsimshianTurkishU.S. Virgin IslanderUgandanUkrainianUruguayanUteVenezuelanVietnameseWelshWest IndianYakamaYaquiYugoslavianYumanYup'ikZimbabwean
Immigration
NonimmigrantsImmigrantsAfghanistanAfricaAlbaniaArgentinaArmeniaAsiaAustraliaAustriaBahamasBangladeshBarbadosBelarusBelgiumBelizeBoliviaBosnia and HerzegovinaBrazilBulgariaBurma/MyanmarCabo VerdeCambodiaCameroonCanadaCaribbeanCentral AmericaChileChinaColombiaCosta RicaCroatiaCubaCzechoslovakiaDenmarkDominicaDominican RepublicEastern AfricaEastern AsiaEastern EuropeEcuadorEgyptEl SalvadorEnglandEritreaEthiopiaEuropeFijiFranceGermanyGhanaGreeceGrenadaGuatemalaGuyanaHaitiHondurasHong KongHungaryIndiaIndonesiaIranIraqIrelandIsraelItalyJamaicaJapanJordanKazakhstanKenyaKoreaKuwaitLaosLatin AmericaLatviaLebanonLiberiaLithuaniaMalaysiaMexicoMicronesiaMiddle AfricaMoldovaMoroccoNepalNetherlandsNicaraguaNigeriaNorth AmericaNorth MacedoniaNorthern AfricaNorthern EuropeNorwayOceaniaPakistanPanamaPeruPhilippinesPolandPortugalRomaniaRussiaSaudi ArabiaScotlandSenegalSerbiaSierra LeoneSingaporeSomaliaSouth AfricaSouth AmericaSouth Central AsiaSouth Eastern AsiaSouthern EuropeSpainSri LankaSt. Vincent and the GrenadinesSudanSwedenSwitzerlandSyriaTaiwanThailandTrinidad and TobagoTurkeyUgandaUkraineUruguayUzbekistanVenezuelaVietnamWest IndiesWestern AfricaWestern AsiaWestern EuropeYemenZaireZimbabweAzores
Disability
Income
Poverty
Unemployment
Labor Participation
Family Structure
Vehicle Availability
Education Level
Disability

Disability Comparison

Immigrants from Congo

Immigrants from Switzerland

Tragic
Exceptional
12.2%
DISABILITY
1.9/ 100
METRIC RATING
237th/ 347
METRIC RANK
11.1%
DISABILITY
99.0/ 100
METRIC RATING
83rd/ 347
METRIC RANK

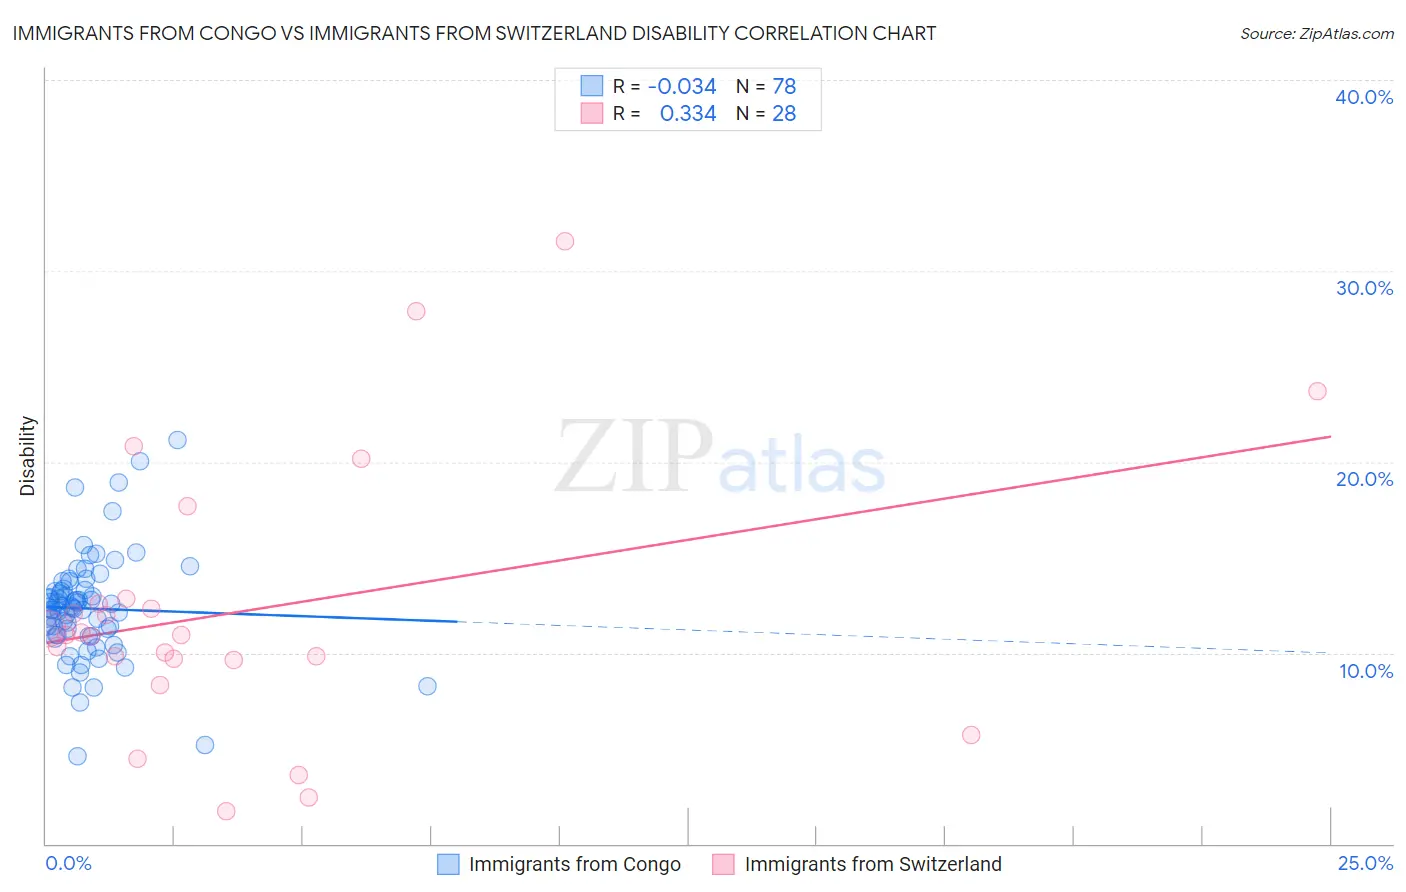
Immigrants from Congo vs Immigrants from Switzerland Disability Correlation Chart

The statistical analysis conducted on geographies consisting of 92,123,108 people shows no correlation between the proportion of Immigrants from Congo and percentage of population with a disability in the United States with a correlation coefficient (R) of -0.034 and weighted average of 12.2%. Similarly, the statistical analysis conducted on geographies consisting of 148,083,084 people shows a mild positive correlation between the proportion of Immigrants from Switzerland and percentage of population with a disability in the United States with a correlation coefficient (R) of 0.334 and weighted average of 11.1%, a difference of 10.0%.
Immigrants from Congo vs Immigrants from Switzerland Disability

Disability Correlation Summary

MeasurementImmigrants from CongoImmigrants from Switzerland
Minimum4.6%1.7%
Maximum21.1%31.6%
Range16.5%29.9%
Mean12.3%12.3%
Median12.4%10.9%
Interquartile 25% (IQ1)10.9%9.7%
Interquartile 75% (IQ3)13.3%12.7%
Interquartile Range (IQR)2.4%3.0%
Standard Deviation (Sample)2.8%7.1%
Standard Deviation (Population)2.8%7.0%

Similar Demographics by Disability

Demographics Similar to Immigrants from Congo by Disability

In terms of disability, the demographic groups most similar to Immigrants from Congo are Norwegian (12.2%, a difference of 0.040%), Chinese (12.2%, a difference of 0.050%), Swedish (12.2%, a difference of 0.080%), Hungarian (12.2%, a difference of 0.13%), and Yugoslavian (12.2%, a difference of 0.13%).
DemographicsRating | RankDisability
Samoans
2.6
/100
|
#230
Tragic
12.2%
Malaysians
2.5
/100
|
#231
Tragic
12.2%
Italians
2.5
/100
|
#232
Tragic
12.2%
Bahamians
2.3
/100
|
#233
Tragic
12.2%
Japanese
2.3
/100
|
#234
Tragic
12.2%
Yup'ik
2.2
/100
|
#235
Tragic
12.2%
Chinese
2.0
/100
|
#236
Tragic
12.2%
Immigrants | Congo
1.9
/100
|
#237
Tragic
12.2%
Norwegians
1.9
/100
|
#238
Tragic
12.2%
Swedes
1.8
/100
|
#239
Tragic
12.2%
Hungarians
1.7
/100
|
#240
Tragic
12.2%
Yugoslavians
1.7
/100
|
#241
Tragic
12.2%
Poles
1.7
/100
|
#242
Tragic
12.2%
British
1.5
/100
|
#243
Tragic
12.2%
Basques
1.5
/100
|
#244
Tragic
12.2%

Demographics Similar to Immigrants from Switzerland by Disability

In terms of disability, the demographic groups most similar to Immigrants from Switzerland are Immigrants from Sierra Leone (11.1%, a difference of 0.010%), Chilean (11.1%, a difference of 0.030%), Immigrants from Poland (11.1%, a difference of 0.080%), Immigrants from Belarus (11.1%, a difference of 0.16%), and Immigrants from Russia (11.1%, a difference of 0.17%).
DemographicsRating | RankDisability
Sierra Leoneans
99.3
/100
|
#76
Exceptional
11.0%
Immigrants | Belgium
99.3
/100
|
#77
Exceptional
11.0%
Immigrants | Cameroon
99.3
/100
|
#78
Exceptional
11.1%
Immigrants | Jordan
99.3
/100
|
#79
Exceptional
11.1%
Immigrants | Ireland
99.3
/100
|
#80
Exceptional
11.1%
Immigrants | Poland
99.1
/100
|
#81
Exceptional
11.1%
Chileans
99.1
/100
|
#82
Exceptional
11.1%
Immigrants | Switzerland
99.0
/100
|
#83
Exceptional
11.1%
Immigrants | Sierra Leone
99.0
/100
|
#84
Exceptional
11.1%
Immigrants | Belarus
98.9
/100
|
#85
Exceptional
11.1%
Immigrants | Russia
98.9
/100
|
#86
Exceptional
11.1%
Palestinians
98.9
/100
|
#87
Exceptional
11.1%
Immigrants | Romania
98.5
/100
|
#88
Exceptional
11.2%
Immigrants | South Africa
98.2
/100
|
#89
Exceptional
11.2%
Immigrants | Brazil
98.1
/100
|
#90
Exceptional
11.2%