Immigrants from Congo vs Immigrants from Germany Disability
COMPARE
Immigrants from Congo
Immigrants from Germany
Disability
Disability Comparison
Immigrants from Congo
Immigrants from Germany
12.2%
DISABILITY
1.9/ 100
METRIC RATING
237th/ 347
METRIC RANK
12.5%
DISABILITY
0.2/ 100
METRIC RATING
264th/ 347
METRIC RANK
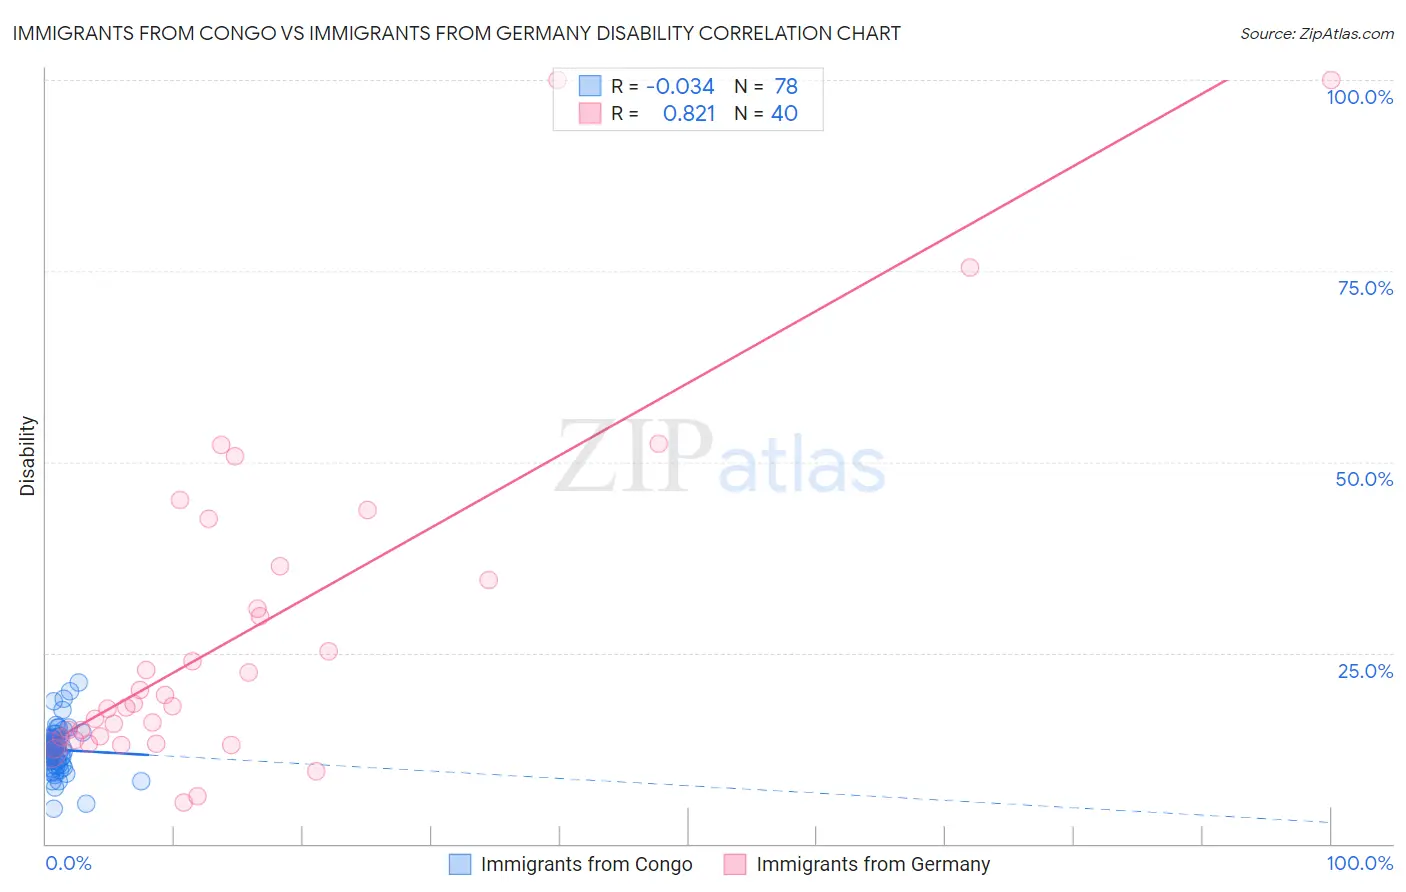
Immigrants from Congo vs Immigrants from Germany Disability Correlation Chart
The statistical analysis conducted on geographies consisting of 92,123,108 people shows no correlation between the proportion of Immigrants from Congo and percentage of population with a disability in the United States with a correlation coefficient (R) of -0.034 and weighted average of 12.2%. Similarly, the statistical analysis conducted on geographies consisting of 463,872,801 people shows a very strong positive correlation between the proportion of Immigrants from Germany and percentage of population with a disability in the United States with a correlation coefficient (R) of 0.821 and weighted average of 12.5%, a difference of 2.3%.
Disability Correlation Summary
| Measurement | Immigrants from Congo | Immigrants from Germany |
| Minimum | 4.6% | 5.3% |
| Maximum | 21.1% | 100.0% |
| Range | 16.5% | 94.7% |
| Mean | 12.3% | 27.9% |
| Median | 12.4% | 18.2% |
| Interquartile 25% (IQ1) | 10.9% | 13.7% |
| Interquartile 75% (IQ3) | 13.3% | 35.4% |
| Interquartile Range (IQR) | 2.4% | 21.7% |
| Standard Deviation (Sample) | 2.8% | 22.6% |
| Standard Deviation (Population) | 2.8% | 22.3% |
Similar Demographics by Disability
Demographics Similar to Immigrants from Congo by Disability
In terms of disability, the demographic groups most similar to Immigrants from Congo are Norwegian (12.2%, a difference of 0.040%), Chinese (12.2%, a difference of 0.050%), Swedish (12.2%, a difference of 0.080%), Hungarian (12.2%, a difference of 0.13%), and Yugoslavian (12.2%, a difference of 0.13%).
| Demographics | Rating | Rank | Disability |
| Samoans | 2.6 /100 | #230 | Tragic 12.2% |
| Malaysians | 2.5 /100 | #231 | Tragic 12.2% |
| Italians | 2.5 /100 | #232 | Tragic 12.2% |
| Bahamians | 2.3 /100 | #233 | Tragic 12.2% |
| Japanese | 2.3 /100 | #234 | Tragic 12.2% |
| Yup'ik | 2.2 /100 | #235 | Tragic 12.2% |
| Chinese | 2.0 /100 | #236 | Tragic 12.2% |
| Immigrants | Congo | 1.9 /100 | #237 | Tragic 12.2% |
| Norwegians | 1.9 /100 | #238 | Tragic 12.2% |
| Swedes | 1.8 /100 | #239 | Tragic 12.2% |
| Hungarians | 1.7 /100 | #240 | Tragic 12.2% |
| Yugoslavians | 1.7 /100 | #241 | Tragic 12.2% |
| Poles | 1.7 /100 | #242 | Tragic 12.2% |
| British | 1.5 /100 | #243 | Tragic 12.2% |
| Basques | 1.5 /100 | #244 | Tragic 12.2% |
Demographics Similar to Immigrants from Germany by Disability
In terms of disability, the demographic groups most similar to Immigrants from Germany are U.S. Virgin Islander (12.5%, a difference of 0.020%), Hawaiian (12.5%, a difference of 0.11%), Czechoslovakian (12.5%, a difference of 0.18%), Spaniard (12.5%, a difference of 0.26%), and Native Hawaiian (12.5%, a difference of 0.32%).
| Demographics | Rating | Rank | Disability |
| Immigrants | Laos | 0.5 /100 | #257 | Tragic 12.4% |
| Slavs | 0.5 /100 | #258 | Tragic 12.4% |
| Canadians | 0.4 /100 | #259 | Tragic 12.4% |
| Immigrants | Liberia | 0.4 /100 | #260 | Tragic 12.4% |
| Scandinavians | 0.4 /100 | #261 | Tragic 12.4% |
| Native Hawaiians | 0.3 /100 | #262 | Tragic 12.5% |
| Hawaiians | 0.2 /100 | #263 | Tragic 12.5% |
| Immigrants | Germany | 0.2 /100 | #264 | Tragic 12.5% |
| U.S. Virgin Islanders | 0.2 /100 | #265 | Tragic 12.5% |
| Czechoslovakians | 0.2 /100 | #266 | Tragic 12.5% |
| Spaniards | 0.2 /100 | #267 | Tragic 12.5% |
| Bangladeshis | 0.1 /100 | #268 | Tragic 12.6% |
| Immigrants | Dominican Republic | 0.1 /100 | #269 | Tragic 12.6% |
| Portuguese | 0.1 /100 | #270 | Tragic 12.6% |
| Immigrants | Yemen | 0.1 /100 | #271 | Tragic 12.6% |