Immigrants from Congo vs Crow Disability
COMPARE
Immigrants from Congo
Crow
Disability
Disability Comparison
Immigrants from Congo
Crow
12.2%
DISABILITY
1.9/ 100
METRIC RATING
237th/ 347
METRIC RANK
12.9%
DISABILITY
0.0/ 100
METRIC RATING
285th/ 347
METRIC RANK
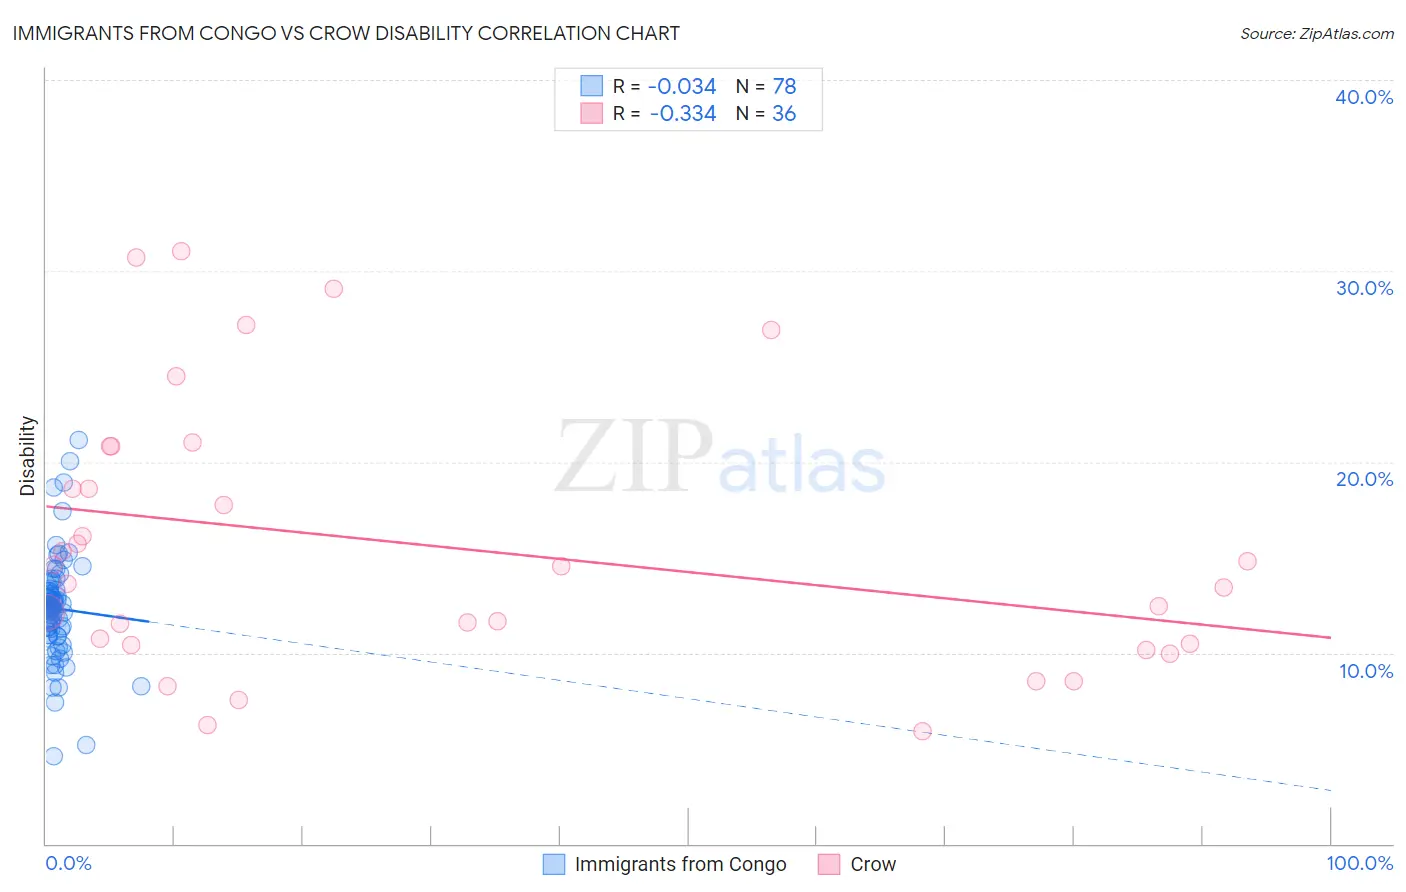
Immigrants from Congo vs Crow Disability Correlation Chart
The statistical analysis conducted on geographies consisting of 92,123,108 people shows no correlation between the proportion of Immigrants from Congo and percentage of population with a disability in the United States with a correlation coefficient (R) of -0.034 and weighted average of 12.2%. Similarly, the statistical analysis conducted on geographies consisting of 59,204,631 people shows a mild negative correlation between the proportion of Crow and percentage of population with a disability in the United States with a correlation coefficient (R) of -0.334 and weighted average of 12.9%, a difference of 5.7%.
Disability Correlation Summary
| Measurement | Immigrants from Congo | Crow |
| Minimum | 4.6% | 5.9% |
| Maximum | 21.1% | 31.1% |
| Range | 16.5% | 25.1% |
| Mean | 12.3% | 15.6% |
| Median | 12.4% | 14.1% |
| Interquartile 25% (IQ1) | 10.9% | 10.4% |
| Interquartile 75% (IQ3) | 13.3% | 19.7% |
| Interquartile Range (IQR) | 2.4% | 9.3% |
| Standard Deviation (Sample) | 2.8% | 7.0% |
| Standard Deviation (Population) | 2.8% | 6.9% |
Similar Demographics by Disability
Demographics Similar to Immigrants from Congo by Disability
In terms of disability, the demographic groups most similar to Immigrants from Congo are Norwegian (12.2%, a difference of 0.040%), Chinese (12.2%, a difference of 0.050%), Swedish (12.2%, a difference of 0.080%), Hungarian (12.2%, a difference of 0.13%), and Yugoslavian (12.2%, a difference of 0.13%).
| Demographics | Rating | Rank | Disability |
| Samoans | 2.6 /100 | #230 | Tragic 12.2% |
| Malaysians | 2.5 /100 | #231 | Tragic 12.2% |
| Italians | 2.5 /100 | #232 | Tragic 12.2% |
| Bahamians | 2.3 /100 | #233 | Tragic 12.2% |
| Japanese | 2.3 /100 | #234 | Tragic 12.2% |
| Yup'ik | 2.2 /100 | #235 | Tragic 12.2% |
| Chinese | 2.0 /100 | #236 | Tragic 12.2% |
| Immigrants | Congo | 1.9 /100 | #237 | Tragic 12.2% |
| Norwegians | 1.9 /100 | #238 | Tragic 12.2% |
| Swedes | 1.8 /100 | #239 | Tragic 12.2% |
| Hungarians | 1.7 /100 | #240 | Tragic 12.2% |
| Yugoslavians | 1.7 /100 | #241 | Tragic 12.2% |
| Poles | 1.7 /100 | #242 | Tragic 12.2% |
| British | 1.5 /100 | #243 | Tragic 12.2% |
| Basques | 1.5 /100 | #244 | Tragic 12.2% |
Demographics Similar to Crow by Disability
In terms of disability, the demographic groups most similar to Crow are Welsh (12.9%, a difference of 0.010%), Irish (12.9%, a difference of 0.20%), Scottish (12.9%, a difference of 0.22%), Immigrants from Portugal (12.9%, a difference of 0.36%), and English (13.0%, a difference of 0.38%).
| Demographics | Rating | Rank | Disability |
| Germans | 0.0 /100 | #278 | Tragic 12.8% |
| Fijians | 0.0 /100 | #279 | Tragic 12.8% |
| Spanish | 0.0 /100 | #280 | Tragic 12.8% |
| Immigrants | Portugal | 0.0 /100 | #281 | Tragic 12.9% |
| Scottish | 0.0 /100 | #282 | Tragic 12.9% |
| Irish | 0.0 /100 | #283 | Tragic 12.9% |
| Welsh | 0.0 /100 | #284 | Tragic 12.9% |
| Crow | 0.0 /100 | #285 | Tragic 12.9% |
| English | 0.0 /100 | #286 | Tragic 13.0% |
| Africans | 0.0 /100 | #287 | Tragic 13.0% |
| Whites/Caucasians | 0.0 /100 | #288 | Tragic 13.0% |
| Slovaks | 0.0 /100 | #289 | Tragic 13.0% |
| Cheyenne | 0.0 /100 | #290 | Tragic 13.0% |
| Yaqui | 0.0 /100 | #291 | Tragic 13.1% |
| Aleuts | 0.0 /100 | #292 | Tragic 13.1% |