Immigrants from Congo vs Chilean Disability
COMPARE
Immigrants from Congo
Chilean
Disability
Disability Comparison
Immigrants from Congo
Chileans
12.2%
DISABILITY
1.9/ 100
METRIC RATING
237th/ 347
METRIC RANK
11.1%
DISABILITY
99.1/ 100
METRIC RATING
82nd/ 347
METRIC RANK
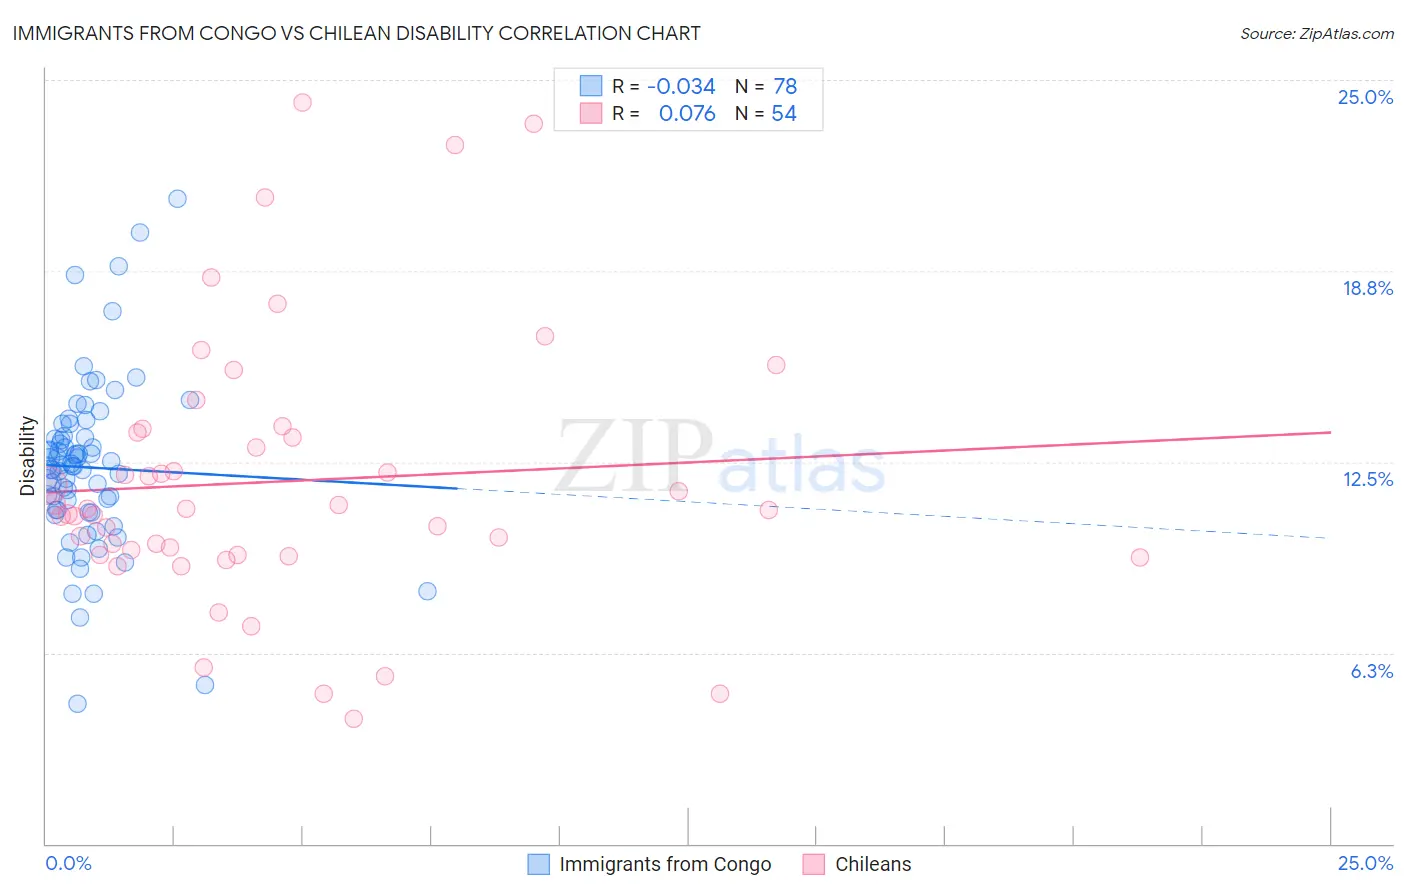
Immigrants from Congo vs Chilean Disability Correlation Chart
The statistical analysis conducted on geographies consisting of 92,123,108 people shows no correlation between the proportion of Immigrants from Congo and percentage of population with a disability in the United States with a correlation coefficient (R) of -0.034 and weighted average of 12.2%. Similarly, the statistical analysis conducted on geographies consisting of 256,664,875 people shows a slight positive correlation between the proportion of Chileans and percentage of population with a disability in the United States with a correlation coefficient (R) of 0.076 and weighted average of 11.1%, a difference of 10.0%.
Disability Correlation Summary
| Measurement | Immigrants from Congo | Chilean |
| Minimum | 4.6% | 4.1% |
| Maximum | 21.1% | 24.3% |
| Range | 16.5% | 20.2% |
| Mean | 12.3% | 11.9% |
| Median | 12.4% | 10.9% |
| Interquartile 25% (IQ1) | 10.9% | 9.5% |
| Interquartile 75% (IQ3) | 13.3% | 13.5% |
| Interquartile Range (IQR) | 2.4% | 4.0% |
| Standard Deviation (Sample) | 2.8% | 4.4% |
| Standard Deviation (Population) | 2.8% | 4.4% |
Similar Demographics by Disability
Demographics Similar to Immigrants from Congo by Disability
In terms of disability, the demographic groups most similar to Immigrants from Congo are Norwegian (12.2%, a difference of 0.040%), Chinese (12.2%, a difference of 0.050%), Swedish (12.2%, a difference of 0.080%), Hungarian (12.2%, a difference of 0.13%), and Yugoslavian (12.2%, a difference of 0.13%).
| Demographics | Rating | Rank | Disability |
| Samoans | 2.6 /100 | #230 | Tragic 12.2% |
| Malaysians | 2.5 /100 | #231 | Tragic 12.2% |
| Italians | 2.5 /100 | #232 | Tragic 12.2% |
| Bahamians | 2.3 /100 | #233 | Tragic 12.2% |
| Japanese | 2.3 /100 | #234 | Tragic 12.2% |
| Yup'ik | 2.2 /100 | #235 | Tragic 12.2% |
| Chinese | 2.0 /100 | #236 | Tragic 12.2% |
| Immigrants | Congo | 1.9 /100 | #237 | Tragic 12.2% |
| Norwegians | 1.9 /100 | #238 | Tragic 12.2% |
| Swedes | 1.8 /100 | #239 | Tragic 12.2% |
| Hungarians | 1.7 /100 | #240 | Tragic 12.2% |
| Yugoslavians | 1.7 /100 | #241 | Tragic 12.2% |
| Poles | 1.7 /100 | #242 | Tragic 12.2% |
| British | 1.5 /100 | #243 | Tragic 12.2% |
| Basques | 1.5 /100 | #244 | Tragic 12.2% |
Demographics Similar to Chileans by Disability
In terms of disability, the demographic groups most similar to Chileans are Immigrants from Switzerland (11.1%, a difference of 0.030%), Immigrants from Poland (11.1%, a difference of 0.050%), Immigrants from Sierra Leone (11.1%, a difference of 0.050%), Immigrants from Belarus (11.1%, a difference of 0.19%), and Immigrants from Russia (11.1%, a difference of 0.20%).
| Demographics | Rating | Rank | Disability |
| Immigrants | Vietnam | 99.4 /100 | #75 | Exceptional 11.0% |
| Sierra Leoneans | 99.3 /100 | #76 | Exceptional 11.0% |
| Immigrants | Belgium | 99.3 /100 | #77 | Exceptional 11.0% |
| Immigrants | Cameroon | 99.3 /100 | #78 | Exceptional 11.1% |
| Immigrants | Jordan | 99.3 /100 | #79 | Exceptional 11.1% |
| Immigrants | Ireland | 99.3 /100 | #80 | Exceptional 11.1% |
| Immigrants | Poland | 99.1 /100 | #81 | Exceptional 11.1% |
| Chileans | 99.1 /100 | #82 | Exceptional 11.1% |
| Immigrants | Switzerland | 99.0 /100 | #83 | Exceptional 11.1% |
| Immigrants | Sierra Leone | 99.0 /100 | #84 | Exceptional 11.1% |
| Immigrants | Belarus | 98.9 /100 | #85 | Exceptional 11.1% |
| Immigrants | Russia | 98.9 /100 | #86 | Exceptional 11.1% |
| Palestinians | 98.9 /100 | #87 | Exceptional 11.1% |
| Immigrants | Romania | 98.5 /100 | #88 | Exceptional 11.2% |
| Immigrants | South Africa | 98.2 /100 | #89 | Exceptional 11.2% |