Immigrants from Congo vs Guyanese Disability
COMPARE
Immigrants from Congo
Guyanese
Disability
Disability Comparison
Immigrants from Congo
Guyanese
12.2%
DISABILITY
1.9/ 100
METRIC RATING
237th/ 347
METRIC RANK
11.3%
DISABILITY
94.7/ 100
METRIC RATING
113th/ 347
METRIC RANK
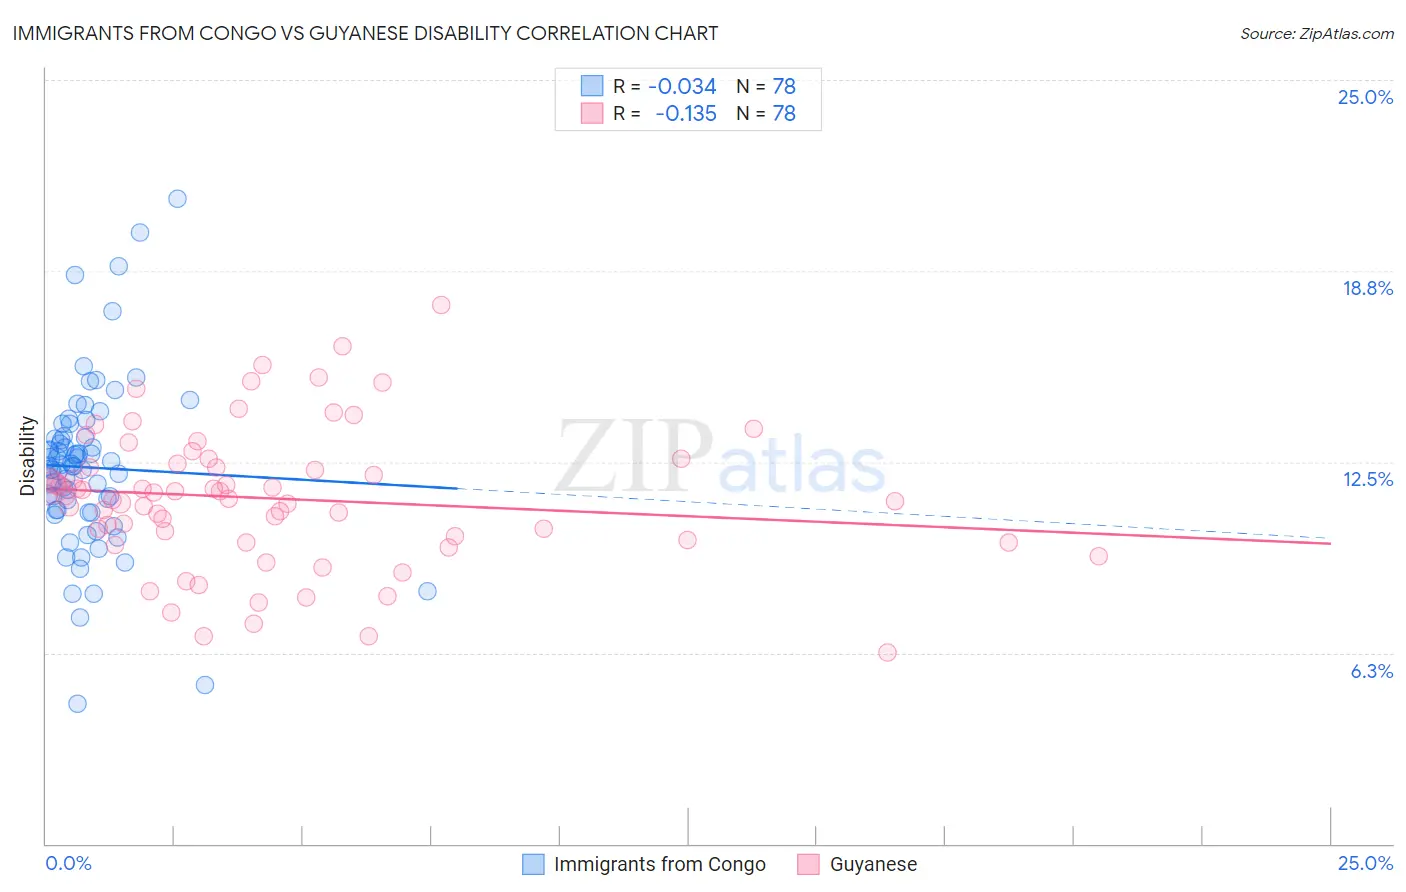
Immigrants from Congo vs Guyanese Disability Correlation Chart
The statistical analysis conducted on geographies consisting of 92,123,108 people shows no correlation between the proportion of Immigrants from Congo and percentage of population with a disability in the United States with a correlation coefficient (R) of -0.034 and weighted average of 12.2%. Similarly, the statistical analysis conducted on geographies consisting of 176,904,345 people shows a poor negative correlation between the proportion of Guyanese and percentage of population with a disability in the United States with a correlation coefficient (R) of -0.135 and weighted average of 11.3%, a difference of 7.8%.
Disability Correlation Summary
| Measurement | Immigrants from Congo | Guyanese |
| Minimum | 4.6% | 6.2% |
| Maximum | 21.1% | 17.6% |
| Range | 16.5% | 11.4% |
| Mean | 12.3% | 11.3% |
| Median | 12.4% | 11.3% |
| Interquartile 25% (IQ1) | 10.9% | 9.9% |
| Interquartile 75% (IQ3) | 13.3% | 12.5% |
| Interquartile Range (IQR) | 2.4% | 2.5% |
| Standard Deviation (Sample) | 2.8% | 2.3% |
| Standard Deviation (Population) | 2.8% | 2.3% |
Similar Demographics by Disability
Demographics Similar to Immigrants from Congo by Disability
In terms of disability, the demographic groups most similar to Immigrants from Congo are Norwegian (12.2%, a difference of 0.040%), Chinese (12.2%, a difference of 0.050%), Swedish (12.2%, a difference of 0.080%), Hungarian (12.2%, a difference of 0.13%), and Yugoslavian (12.2%, a difference of 0.13%).
| Demographics | Rating | Rank | Disability |
| Samoans | 2.6 /100 | #230 | Tragic 12.2% |
| Malaysians | 2.5 /100 | #231 | Tragic 12.2% |
| Italians | 2.5 /100 | #232 | Tragic 12.2% |
| Bahamians | 2.3 /100 | #233 | Tragic 12.2% |
| Japanese | 2.3 /100 | #234 | Tragic 12.2% |
| Yup'ik | 2.2 /100 | #235 | Tragic 12.2% |
| Chinese | 2.0 /100 | #236 | Tragic 12.2% |
| Immigrants | Congo | 1.9 /100 | #237 | Tragic 12.2% |
| Norwegians | 1.9 /100 | #238 | Tragic 12.2% |
| Swedes | 1.8 /100 | #239 | Tragic 12.2% |
| Hungarians | 1.7 /100 | #240 | Tragic 12.2% |
| Yugoslavians | 1.7 /100 | #241 | Tragic 12.2% |
| Poles | 1.7 /100 | #242 | Tragic 12.2% |
| British | 1.5 /100 | #243 | Tragic 12.2% |
| Basques | 1.5 /100 | #244 | Tragic 12.2% |
Demographics Similar to Guyanese by Disability
In terms of disability, the demographic groups most similar to Guyanese are Immigrants from Syria (11.3%, a difference of 0.010%), Immigrants from Philippines (11.3%, a difference of 0.020%), Immigrants from Uzbekistan (11.3%, a difference of 0.040%), Immigrants from Northern Europe (11.3%, a difference of 0.13%), and Immigrants from South Eastern Asia (11.3%, a difference of 0.16%).
| Demographics | Rating | Rank | Disability |
| Immigrants | Eastern Europe | 96.3 /100 | #106 | Exceptional 11.3% |
| Nicaraguans | 96.2 /100 | #107 | Exceptional 11.3% |
| Immigrants | Nigeria | 96.0 /100 | #108 | Exceptional 11.3% |
| Immigrants | Uganda | 95.7 /100 | #109 | Exceptional 11.3% |
| Immigrants | Denmark | 95.6 /100 | #110 | Exceptional 11.3% |
| Immigrants | South Eastern Asia | 95.4 /100 | #111 | Exceptional 11.3% |
| Immigrants | Uzbekistan | 94.9 /100 | #112 | Exceptional 11.3% |
| Guyanese | 94.7 /100 | #113 | Exceptional 11.3% |
| Immigrants | Syria | 94.7 /100 | #114 | Exceptional 11.3% |
| Immigrants | Philippines | 94.6 /100 | #115 | Exceptional 11.3% |
| Immigrants | Northern Europe | 94.1 /100 | #116 | Exceptional 11.3% |
| Luxembourgers | 93.9 /100 | #117 | Exceptional 11.3% |
| Koreans | 93.8 /100 | #118 | Exceptional 11.3% |
| Central Americans | 93.5 /100 | #119 | Exceptional 11.4% |
| Immigrants | North Macedonia | 93.5 /100 | #120 | Exceptional 11.4% |