Immigrants from Austria vs Subsaharan African Disability
COMPARE
Immigrants from Austria
Subsaharan African
Disability
Disability Comparison
Immigrants from Austria
Sub-Saharan Africans
11.7%
DISABILITY
53.4/ 100
METRIC RATING
169th/ 347
METRIC RANK
12.3%
DISABILITY
1.4/ 100
METRIC RATING
250th/ 347
METRIC RANK
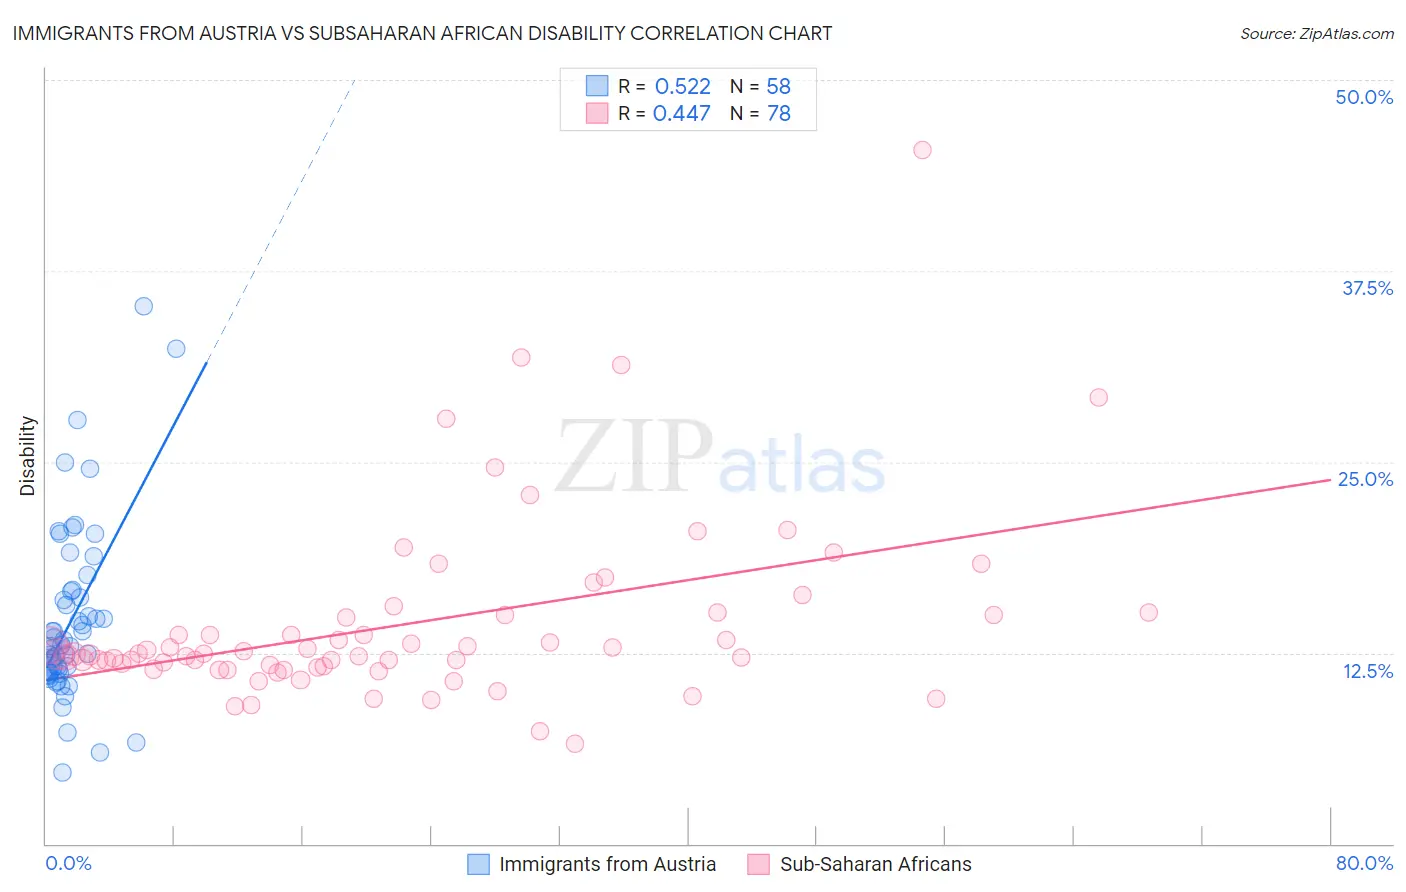
Immigrants from Austria vs Subsaharan African Disability Correlation Chart
The statistical analysis conducted on geographies consisting of 167,973,413 people shows a substantial positive correlation between the proportion of Immigrants from Austria and percentage of population with a disability in the United States with a correlation coefficient (R) of 0.522 and weighted average of 11.7%. Similarly, the statistical analysis conducted on geographies consisting of 508,103,774 people shows a moderate positive correlation between the proportion of Sub-Saharan Africans and percentage of population with a disability in the United States with a correlation coefficient (R) of 0.447 and weighted average of 12.3%, a difference of 4.9%.
Disability Correlation Summary
| Measurement | Immigrants from Austria | Subsaharan African |
| Minimum | 4.6% | 6.6% |
| Maximum | 35.2% | 45.5% |
| Range | 30.5% | 38.9% |
| Mean | 14.6% | 14.4% |
| Median | 13.0% | 12.4% |
| Interquartile 25% (IQ1) | 11.2% | 11.6% |
| Interquartile 75% (IQ3) | 16.5% | 14.9% |
| Interquartile Range (IQR) | 5.3% | 3.3% |
| Standard Deviation (Sample) | 5.8% | 6.1% |
| Standard Deviation (Population) | 5.8% | 6.0% |
Similar Demographics by Disability
Demographics Similar to Immigrants from Austria by Disability
In terms of disability, the demographic groups most similar to Immigrants from Austria are Immigrants from Latin America (11.7%, a difference of 0.030%), Immigrants from Albania (11.7%, a difference of 0.030%), Immigrants from Southern Europe (11.7%, a difference of 0.030%), Trinidadian and Tobagonian (11.7%, a difference of 0.030%), and Estonian (11.7%, a difference of 0.050%).
| Demographics | Rating | Rank | Disability |
| Immigrants | Haiti | 59.2 /100 | #162 | Average 11.7% |
| Immigrants | Trinidad and Tobago | 58.9 /100 | #163 | Average 11.7% |
| Syrians | 58.5 /100 | #164 | Average 11.7% |
| Cubans | 56.7 /100 | #165 | Average 11.7% |
| Pakistanis | 54.7 /100 | #166 | Average 11.7% |
| Estonians | 54.4 /100 | #167 | Average 11.7% |
| Immigrants | Latin America | 54.1 /100 | #168 | Average 11.7% |
| Immigrants | Austria | 53.4 /100 | #169 | Average 11.7% |
| Immigrants | Albania | 52.8 /100 | #170 | Average 11.7% |
| Immigrants | Southern Europe | 52.8 /100 | #171 | Average 11.7% |
| Trinidadians and Tobagonians | 52.7 /100 | #172 | Average 11.7% |
| Maltese | 50.6 /100 | #173 | Average 11.7% |
| Albanians | 50.0 /100 | #174 | Average 11.7% |
| Haitians | 48.6 /100 | #175 | Average 11.7% |
| Immigrants | Western Africa | 47.5 /100 | #176 | Average 11.7% |
Demographics Similar to Sub-Saharan Africans by Disability
In terms of disability, the demographic groups most similar to Sub-Saharan Africans are European (12.3%, a difference of 0.0%), Carpatho Rusyn (12.3%, a difference of 0.010%), Guamanian/Chamorro (12.3%, a difference of 0.020%), Indonesian (12.2%, a difference of 0.060%), and Swiss (12.2%, a difference of 0.090%).
| Demographics | Rating | Rank | Disability |
| British | 1.5 /100 | #243 | Tragic 12.2% |
| Basques | 1.5 /100 | #244 | Tragic 12.2% |
| Liberians | 1.5 /100 | #245 | Tragic 12.2% |
| Swiss | 1.5 /100 | #246 | Tragic 12.2% |
| Indonesians | 1.4 /100 | #247 | Tragic 12.2% |
| Guamanians/Chamorros | 1.4 /100 | #248 | Tragic 12.3% |
| Carpatho Rusyns | 1.4 /100 | #249 | Tragic 12.3% |
| Sub-Saharan Africans | 1.4 /100 | #250 | Tragic 12.3% |
| Europeans | 1.4 /100 | #251 | Tragic 12.3% |
| Bermudans | 1.1 /100 | #252 | Tragic 12.3% |
| Belgians | 0.8 /100 | #253 | Tragic 12.3% |
| German Russians | 0.8 /100 | #254 | Tragic 12.3% |
| Slovenes | 0.6 /100 | #255 | Tragic 12.4% |
| Immigrants | Dominica | 0.6 /100 | #256 | Tragic 12.4% |
| Immigrants | Laos | 0.5 /100 | #257 | Tragic 12.4% |