Cheyenne vs Subsaharan African Disability
COMPARE
Cheyenne
Subsaharan African
Disability
Disability Comparison
Cheyenne
Sub-Saharan Africans
13.0%
DISABILITY
0.0/ 100
METRIC RATING
290th/ 347
METRIC RANK
12.3%
DISABILITY
1.4/ 100
METRIC RATING
250th/ 347
METRIC RANK
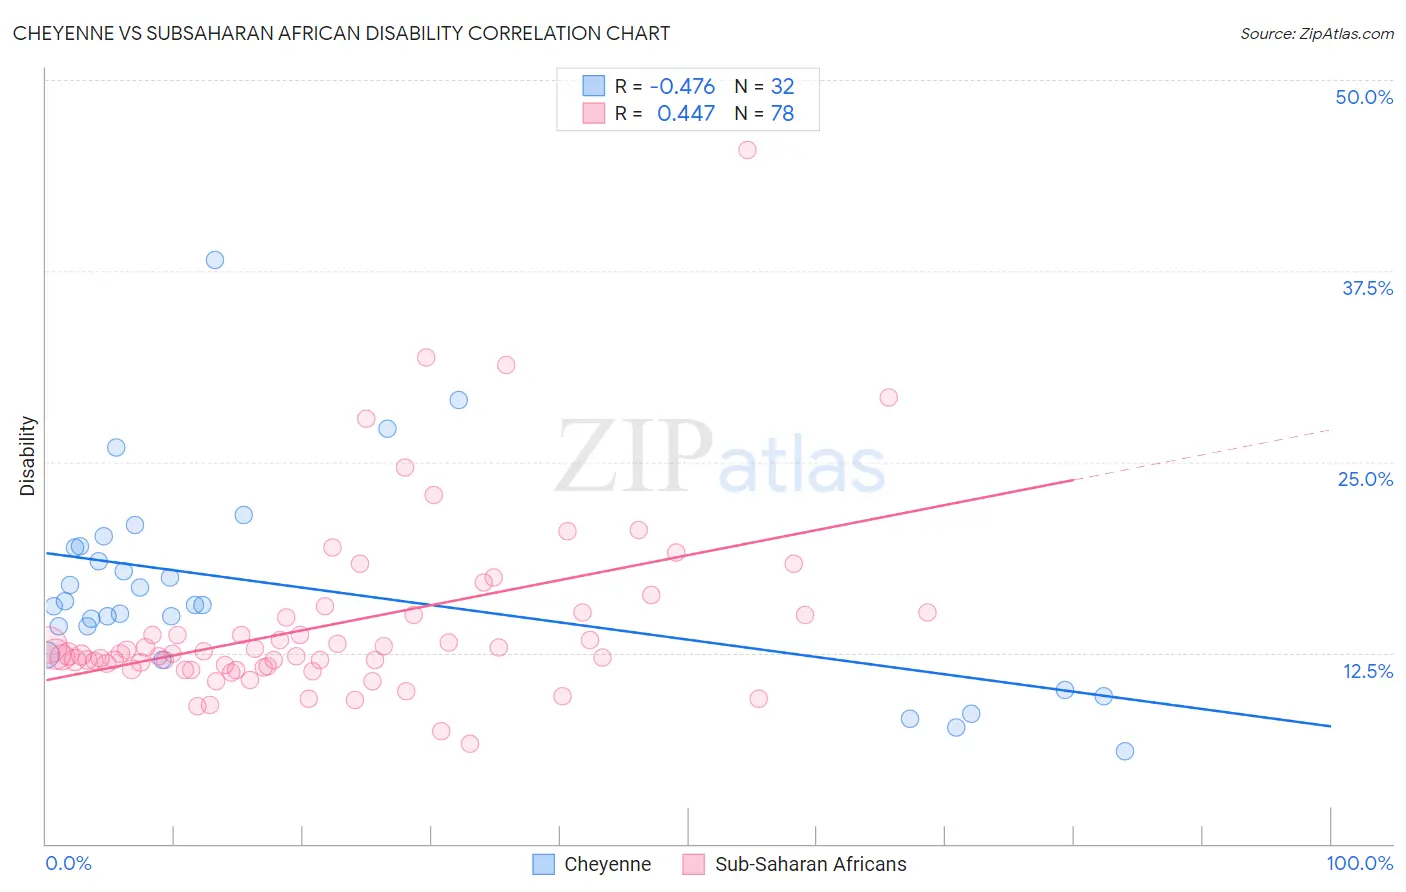
Cheyenne vs Subsaharan African Disability Correlation Chart
The statistical analysis conducted on geographies consisting of 80,710,371 people shows a moderate negative correlation between the proportion of Cheyenne and percentage of population with a disability in the United States with a correlation coefficient (R) of -0.476 and weighted average of 13.0%. Similarly, the statistical analysis conducted on geographies consisting of 508,103,774 people shows a moderate positive correlation between the proportion of Sub-Saharan Africans and percentage of population with a disability in the United States with a correlation coefficient (R) of 0.447 and weighted average of 12.3%, a difference of 6.2%.
Disability Correlation Summary
| Measurement | Cheyenne | Subsaharan African |
| Minimum | 6.1% | 6.6% |
| Maximum | 38.2% | 45.5% |
| Range | 32.2% | 38.9% |
| Mean | 16.7% | 14.4% |
| Median | 15.6% | 12.4% |
| Interquartile 25% (IQ1) | 13.3% | 11.6% |
| Interquartile 75% (IQ3) | 19.4% | 14.9% |
| Interquartile Range (IQR) | 6.1% | 3.3% |
| Standard Deviation (Sample) | 6.7% | 6.1% |
| Standard Deviation (Population) | 6.6% | 6.0% |
Similar Demographics by Disability
Demographics Similar to Cheyenne by Disability
In terms of disability, the demographic groups most similar to Cheyenne are White/Caucasian (13.0%, a difference of 0.060%), Slovak (13.0%, a difference of 0.060%), African (13.0%, a difference of 0.080%), Yaqui (13.1%, a difference of 0.23%), and English (13.0%, a difference of 0.49%).
| Demographics | Rating | Rank | Disability |
| Irish | 0.0 /100 | #283 | Tragic 12.9% |
| Welsh | 0.0 /100 | #284 | Tragic 12.9% |
| Crow | 0.0 /100 | #285 | Tragic 12.9% |
| English | 0.0 /100 | #286 | Tragic 13.0% |
| Africans | 0.0 /100 | #287 | Tragic 13.0% |
| Whites/Caucasians | 0.0 /100 | #288 | Tragic 13.0% |
| Slovaks | 0.0 /100 | #289 | Tragic 13.0% |
| Cheyenne | 0.0 /100 | #290 | Tragic 13.0% |
| Yaqui | 0.0 /100 | #291 | Tragic 13.1% |
| Aleuts | 0.0 /100 | #292 | Tragic 13.1% |
| Marshallese | 0.0 /100 | #293 | Tragic 13.1% |
| Celtics | 0.0 /100 | #294 | Tragic 13.1% |
| Immigrants | Nonimmigrants | 0.0 /100 | #295 | Tragic 13.2% |
| Central American Indians | 0.0 /100 | #296 | Tragic 13.2% |
| Hopi | 0.0 /100 | #297 | Tragic 13.2% |
Demographics Similar to Sub-Saharan Africans by Disability
In terms of disability, the demographic groups most similar to Sub-Saharan Africans are European (12.3%, a difference of 0.0%), Carpatho Rusyn (12.3%, a difference of 0.010%), Guamanian/Chamorro (12.3%, a difference of 0.020%), Indonesian (12.2%, a difference of 0.060%), and Swiss (12.2%, a difference of 0.090%).
| Demographics | Rating | Rank | Disability |
| British | 1.5 /100 | #243 | Tragic 12.2% |
| Basques | 1.5 /100 | #244 | Tragic 12.2% |
| Liberians | 1.5 /100 | #245 | Tragic 12.2% |
| Swiss | 1.5 /100 | #246 | Tragic 12.2% |
| Indonesians | 1.4 /100 | #247 | Tragic 12.2% |
| Guamanians/Chamorros | 1.4 /100 | #248 | Tragic 12.3% |
| Carpatho Rusyns | 1.4 /100 | #249 | Tragic 12.3% |
| Sub-Saharan Africans | 1.4 /100 | #250 | Tragic 12.3% |
| Europeans | 1.4 /100 | #251 | Tragic 12.3% |
| Bermudans | 1.1 /100 | #252 | Tragic 12.3% |
| Belgians | 0.8 /100 | #253 | Tragic 12.3% |
| German Russians | 0.8 /100 | #254 | Tragic 12.3% |
| Slovenes | 0.6 /100 | #255 | Tragic 12.4% |
| Immigrants | Dominica | 0.6 /100 | #256 | Tragic 12.4% |
| Immigrants | Laos | 0.5 /100 | #257 | Tragic 12.4% |