Immigrants from Canada vs Immigrants from Europe Male Disability
COMPARE
Immigrants from Canada
Immigrants from Europe
Male Disability
Male Disability Comparison
Immigrants from Canada
Immigrants from Europe
11.9%
MALE DISABILITY
1.6/ 100
METRIC RATING
234th/ 347
METRIC RANK
11.0%
MALE DISABILITY
82.0/ 100
METRIC RATING
137th/ 347
METRIC RANK
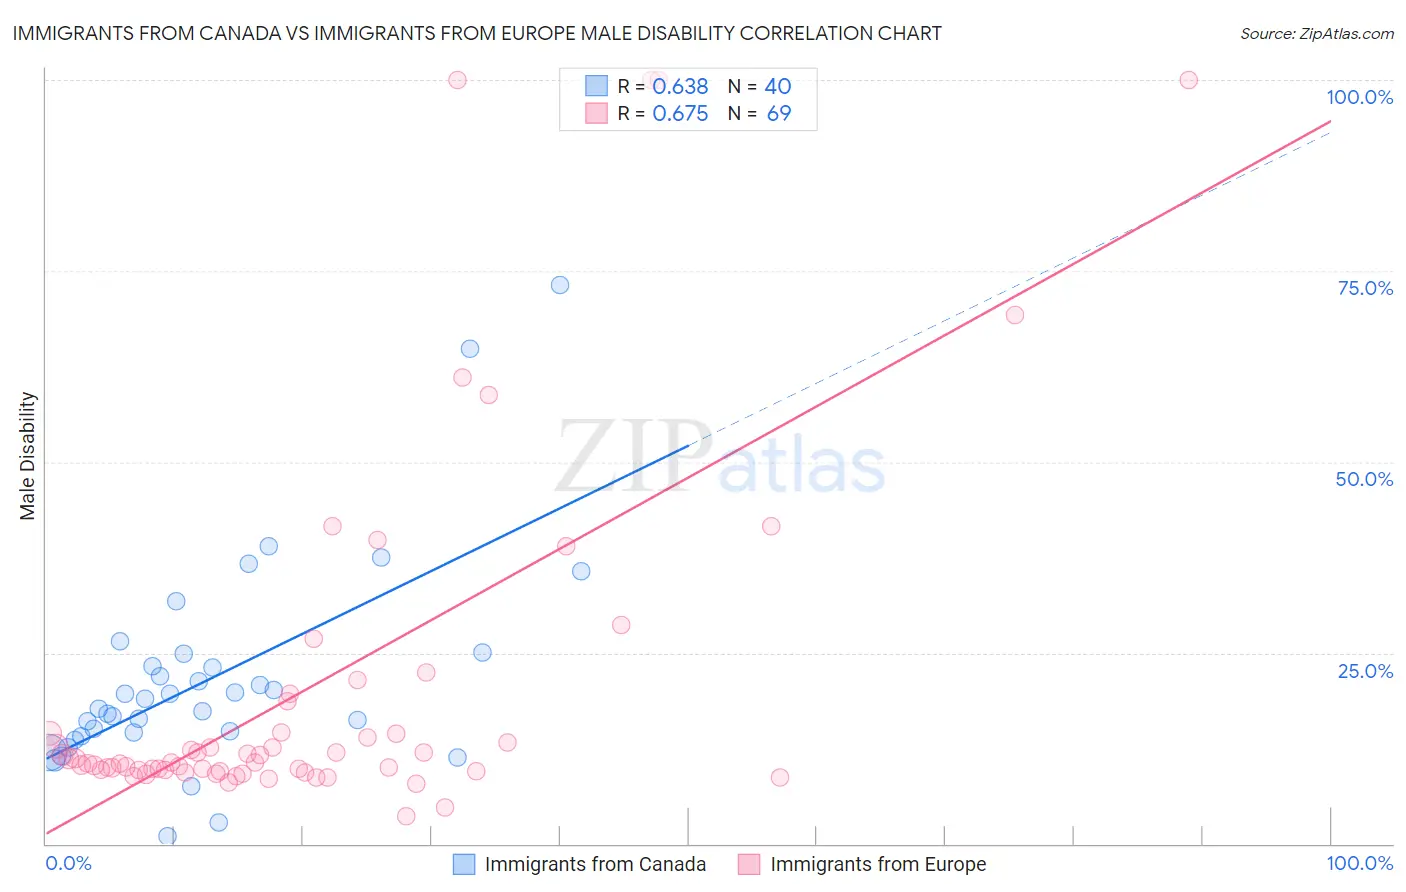
Immigrants from Canada vs Immigrants from Europe Male Disability Correlation Chart
The statistical analysis conducted on geographies consisting of 459,334,704 people shows a significant positive correlation between the proportion of Immigrants from Canada and percentage of males with a disability in the United States with a correlation coefficient (R) of 0.638 and weighted average of 11.9%. Similarly, the statistical analysis conducted on geographies consisting of 547,240,570 people shows a significant positive correlation between the proportion of Immigrants from Europe and percentage of males with a disability in the United States with a correlation coefficient (R) of 0.675 and weighted average of 11.0%, a difference of 8.0%.
Male Disability Correlation Summary
| Measurement | Immigrants from Canada | Immigrants from Europe |
| Minimum | 1.0% | 3.6% |
| Maximum | 73.2% | 100.0% |
| Range | 72.2% | 96.4% |
| Mean | 21.6% | 20.7% |
| Median | 18.4% | 10.7% |
| Interquartile 25% (IQ1) | 14.4% | 9.6% |
| Interquartile 75% (IQ3) | 24.1% | 16.6% |
| Interquartile Range (IQR) | 9.8% | 7.0% |
| Standard Deviation (Sample) | 14.0% | 23.7% |
| Standard Deviation (Population) | 13.8% | 23.5% |
Similar Demographics by Male Disability
Demographics Similar to Immigrants from Canada by Male Disability
In terms of male disability, the demographic groups most similar to Immigrants from Canada are Mexican (11.8%, a difference of 0.070%), Malaysian (11.8%, a difference of 0.11%), Immigrants from North America (11.9%, a difference of 0.13%), Dominican (11.8%, a difference of 0.18%), and U.S. Virgin Islander (11.9%, a difference of 0.26%).
| Demographics | Rating | Rank | Male Disability |
| Austrians | 2.5 /100 | #227 | Tragic 11.8% |
| Hispanics or Latinos | 2.3 /100 | #228 | Tragic 11.8% |
| Bermudans | 2.3 /100 | #229 | Tragic 11.8% |
| Croatians | 2.1 /100 | #230 | Tragic 11.8% |
| Dominicans | 1.8 /100 | #231 | Tragic 11.8% |
| Malaysians | 1.8 /100 | #232 | Tragic 11.8% |
| Mexicans | 1.7 /100 | #233 | Tragic 11.8% |
| Immigrants | Canada | 1.6 /100 | #234 | Tragic 11.9% |
| Immigrants | North America | 1.5 /100 | #235 | Tragic 11.9% |
| U.S. Virgin Islanders | 1.3 /100 | #236 | Tragic 11.9% |
| Carpatho Rusyns | 1.3 /100 | #237 | Tragic 11.9% |
| Yugoslavians | 1.2 /100 | #238 | Tragic 11.9% |
| Italians | 1.2 /100 | #239 | Tragic 11.9% |
| Czechs | 1.1 /100 | #240 | Tragic 11.9% |
| Bahamians | 1.1 /100 | #241 | Tragic 11.9% |
Demographics Similar to Immigrants from Europe by Male Disability
In terms of male disability, the demographic groups most similar to Immigrants from Europe are Nigerian (11.0%, a difference of 0.010%), South African (11.0%, a difference of 0.030%), Immigrants from Italy (11.0%, a difference of 0.040%), Arab (11.0%, a difference of 0.050%), and Immigrants from Sudan (11.0%, a difference of 0.050%).
| Demographics | Rating | Rank | Male Disability |
| Brazilians | 85.4 /100 | #130 | Excellent 10.9% |
| Macedonians | 84.2 /100 | #131 | Excellent 11.0% |
| Immigrants | Fiji | 84.0 /100 | #132 | Excellent 11.0% |
| Ugandans | 83.9 /100 | #133 | Excellent 11.0% |
| Bhutanese | 83.4 /100 | #134 | Excellent 11.0% |
| Trinidadians and Tobagonians | 83.3 /100 | #135 | Excellent 11.0% |
| Immigrants | Costa Rica | 82.8 /100 | #136 | Excellent 11.0% |
| Immigrants | Europe | 82.0 /100 | #137 | Excellent 11.0% |
| Nigerians | 81.9 /100 | #138 | Excellent 11.0% |
| South Africans | 81.7 /100 | #139 | Excellent 11.0% |
| Immigrants | Italy | 81.5 /100 | #140 | Excellent 11.0% |
| Arabs | 81.5 /100 | #141 | Excellent 11.0% |
| Immigrants | Sudan | 81.5 /100 | #142 | Excellent 11.0% |
| Moroccans | 80.7 /100 | #143 | Excellent 11.0% |
| Kenyans | 78.1 /100 | #144 | Good 11.0% |