Immigrants from Canada vs British Male Disability
COMPARE
Immigrants from Canada
British
Male Disability
Male Disability Comparison
Immigrants from Canada
British
11.9%
MALE DISABILITY
1.6/ 100
METRIC RATING
234th/ 347
METRIC RANK
12.1%
MALE DISABILITY
0.4/ 100
METRIC RATING
254th/ 347
METRIC RANK
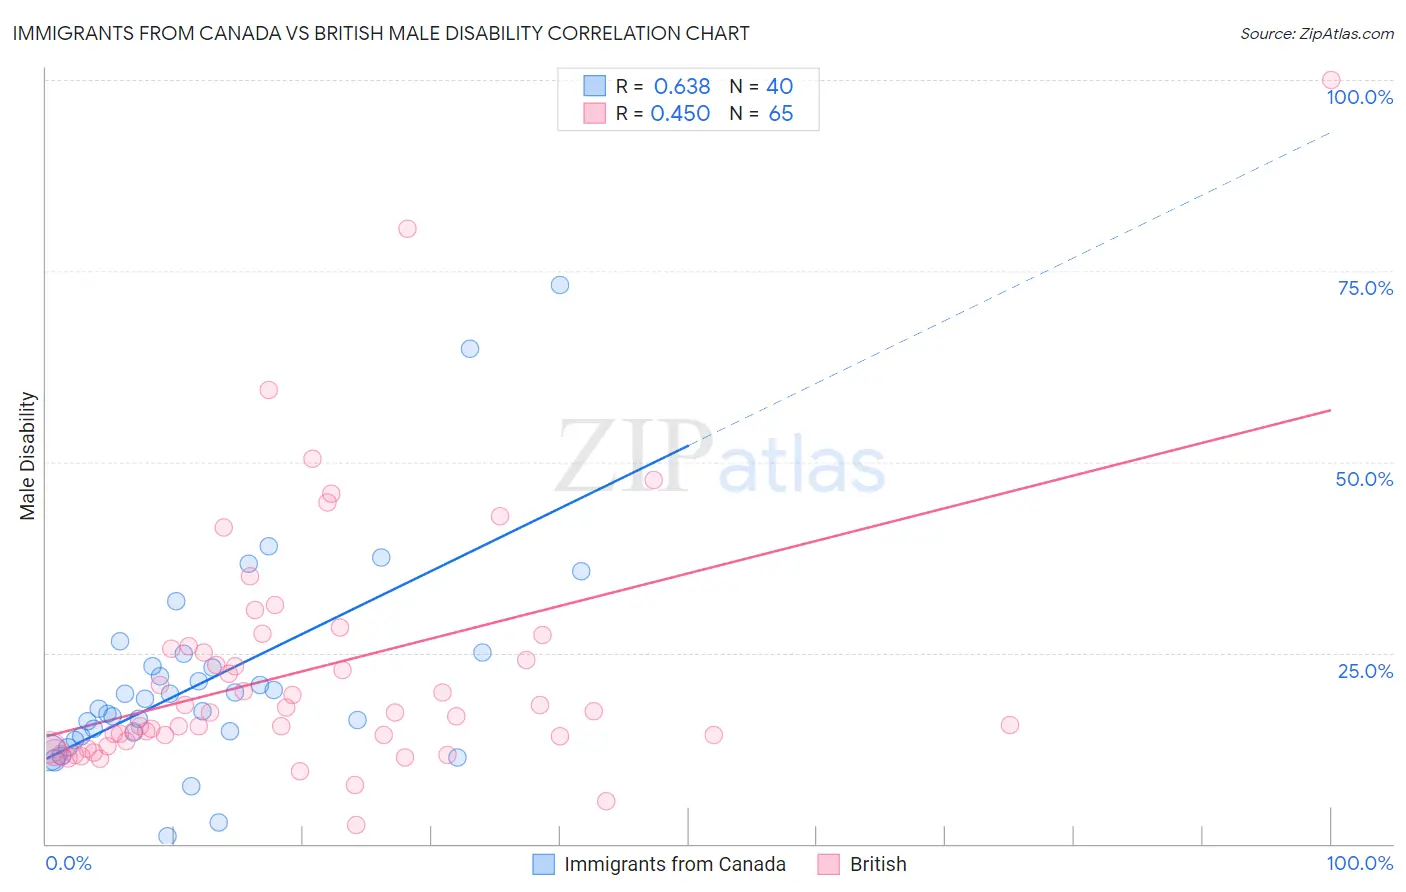
Immigrants from Canada vs British Male Disability Correlation Chart
The statistical analysis conducted on geographies consisting of 459,334,704 people shows a significant positive correlation between the proportion of Immigrants from Canada and percentage of males with a disability in the United States with a correlation coefficient (R) of 0.638 and weighted average of 11.9%. Similarly, the statistical analysis conducted on geographies consisting of 531,329,993 people shows a moderate positive correlation between the proportion of British and percentage of males with a disability in the United States with a correlation coefficient (R) of 0.450 and weighted average of 12.1%, a difference of 1.8%.
Male Disability Correlation Summary
| Measurement | Immigrants from Canada | British |
| Minimum | 1.0% | 2.5% |
| Maximum | 73.2% | 100.0% |
| Range | 72.2% | 97.5% |
| Mean | 21.6% | 22.7% |
| Median | 18.4% | 17.1% |
| Interquartile 25% (IQ1) | 14.4% | 13.2% |
| Interquartile 75% (IQ3) | 24.1% | 25.7% |
| Interquartile Range (IQR) | 9.8% | 12.5% |
| Standard Deviation (Sample) | 14.0% | 16.7% |
| Standard Deviation (Population) | 13.8% | 16.6% |
Demographics Similar to Immigrants from Canada and British by Male Disability
In terms of male disability, the demographic groups most similar to Immigrants from Canada are Immigrants from North America (11.9%, a difference of 0.13%), U.S. Virgin Islander (11.9%, a difference of 0.26%), Carpatho Rusyn (11.9%, a difference of 0.28%), Yugoslavian (11.9%, a difference of 0.37%), and Italian (11.9%, a difference of 0.43%). Similarly, the demographic groups most similar to British are Guamanian/Chamorro (12.0%, a difference of 0.18%), Slovene (12.0%, a difference of 0.19%), German Russian (12.0%, a difference of 0.26%), Bangladeshi (12.0%, a difference of 0.27%), and Immigrants from Yemen (12.0%, a difference of 0.32%).
| Demographics | Rating | Rank | Male Disability |
| Immigrants | Canada | 1.6 /100 | #234 | Tragic 11.9% |
| Immigrants | North America | 1.5 /100 | #235 | Tragic 11.9% |
| U.S. Virgin Islanders | 1.3 /100 | #236 | Tragic 11.9% |
| Carpatho Rusyns | 1.3 /100 | #237 | Tragic 11.9% |
| Yugoslavians | 1.2 /100 | #238 | Tragic 11.9% |
| Italians | 1.2 /100 | #239 | Tragic 11.9% |
| Czechs | 1.1 /100 | #240 | Tragic 11.9% |
| Bahamians | 1.1 /100 | #241 | Tragic 11.9% |
| Northern Europeans | 1.1 /100 | #242 | Tragic 11.9% |
| Samoans | 1.1 /100 | #243 | Tragic 11.9% |
| Immigrants | Laos | 1.0 /100 | #244 | Tragic 11.9% |
| Immigrants | Liberia | 1.0 /100 | #245 | Tragic 11.9% |
| Danes | 0.9 /100 | #246 | Tragic 11.9% |
| Hungarians | 0.8 /100 | #247 | Tragic 12.0% |
| Poles | 0.7 /100 | #248 | Tragic 12.0% |
| Immigrants | Yemen | 0.5 /100 | #249 | Tragic 12.0% |
| Bangladeshis | 0.5 /100 | #250 | Tragic 12.0% |
| German Russians | 0.5 /100 | #251 | Tragic 12.0% |
| Slovenes | 0.5 /100 | #252 | Tragic 12.0% |
| Guamanians/Chamorros | 0.5 /100 | #253 | Tragic 12.0% |
| British | 0.4 /100 | #254 | Tragic 12.1% |