Immigrants from Canada vs Chickasaw GED/Equivalency
COMPARE
Immigrants from Canada
Chickasaw
GED/Equivalency
GED/Equivalency Comparison
Immigrants from Canada
Chickasaw
87.9%
GED/EQUIVALENCY
99.2/ 100
METRIC RATING
64th/ 347
METRIC RANK
83.8%
GED/EQUIVALENCY
1.2/ 100
METRIC RATING
246th/ 347
METRIC RANK
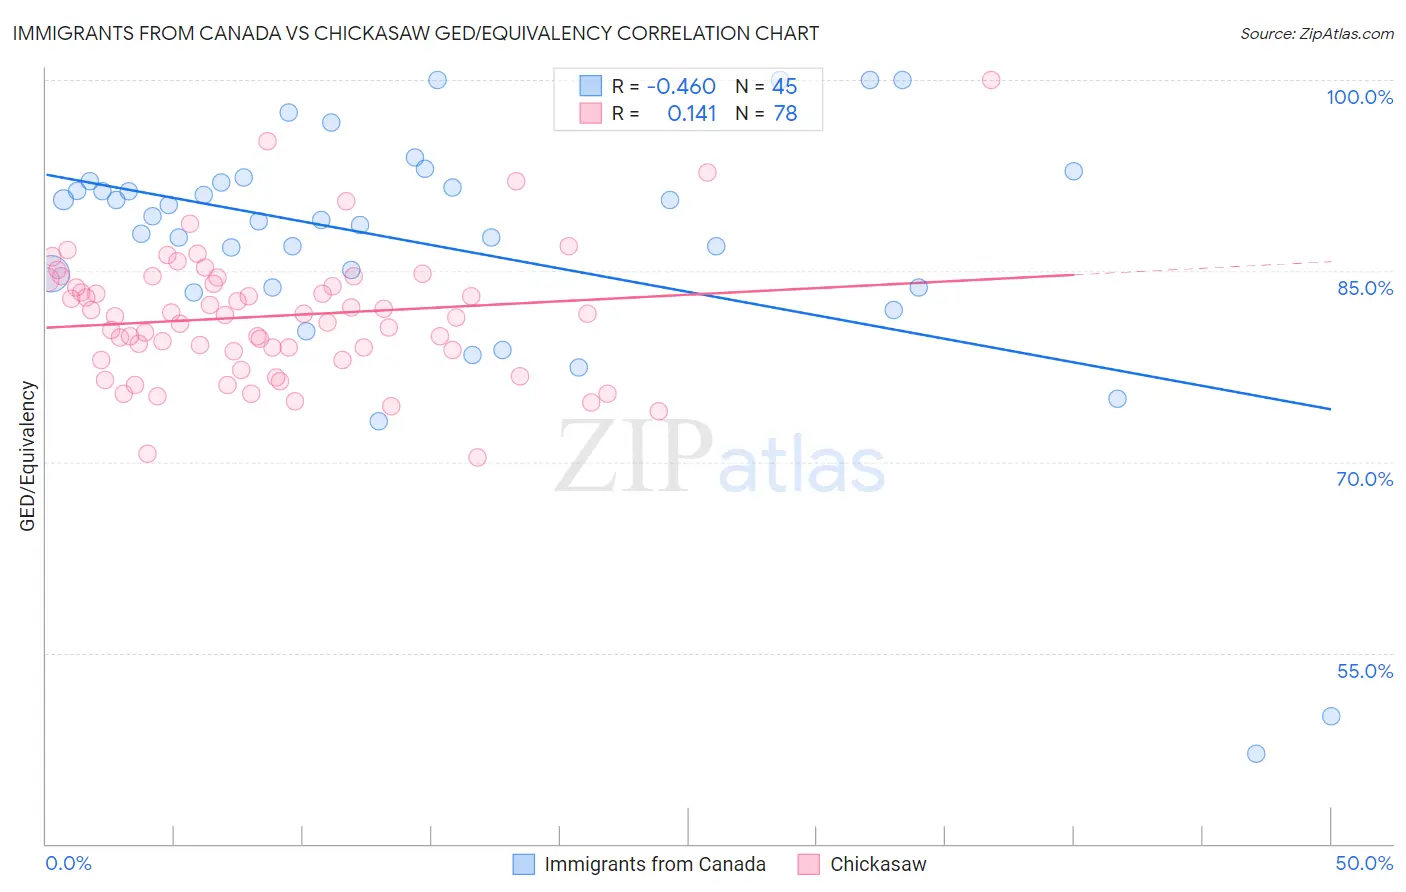
Immigrants from Canada vs Chickasaw GED/Equivalency Correlation Chart
The statistical analysis conducted on geographies consisting of 459,397,064 people shows a moderate negative correlation between the proportion of Immigrants from Canada and percentage of population with at least ged/equivalency education in the United States with a correlation coefficient (R) of -0.460 and weighted average of 87.9%. Similarly, the statistical analysis conducted on geographies consisting of 147,726,505 people shows a poor positive correlation between the proportion of Chickasaw and percentage of population with at least ged/equivalency education in the United States with a correlation coefficient (R) of 0.141 and weighted average of 83.8%, a difference of 4.8%.
GED/Equivalency Correlation Summary
| Measurement | Immigrants from Canada | Chickasaw |
| Minimum | 47.1% | 70.4% |
| Maximum | 100.0% | 100.0% |
| Range | 52.9% | 29.6% |
| Mean | 86.9% | 81.5% |
| Median | 89.0% | 81.5% |
| Interquartile 25% (IQ1) | 83.7% | 78.6% |
| Interquartile 75% (IQ3) | 92.0% | 84.3% |
| Interquartile Range (IQR) | 8.3% | 5.7% |
| Standard Deviation (Sample) | 10.5% | 5.1% |
| Standard Deviation (Population) | 10.4% | 5.1% |
Similar Demographics by GED/Equivalency
Demographics Similar to Immigrants from Canada by GED/Equivalency
In terms of ged/equivalency, the demographic groups most similar to Immigrants from Canada are Immigrants from North America (87.8%, a difference of 0.030%), Immigrants from Bulgaria (87.8%, a difference of 0.030%), Immigrants from Turkey (87.9%, a difference of 0.040%), German (87.9%, a difference of 0.050%), and British (87.8%, a difference of 0.050%).
| Demographics | Rating | Rank | GED/Equivalency |
| Immigrants | Czechoslovakia | 99.3 /100 | #57 | Exceptional 87.9% |
| Northern Europeans | 99.3 /100 | #58 | Exceptional 87.9% |
| Serbians | 99.3 /100 | #59 | Exceptional 87.9% |
| Scandinavians | 99.3 /100 | #60 | Exceptional 87.9% |
| Europeans | 99.3 /100 | #61 | Exceptional 87.9% |
| Germans | 99.3 /100 | #62 | Exceptional 87.9% |
| Immigrants | Turkey | 99.2 /100 | #63 | Exceptional 87.9% |
| Immigrants | Canada | 99.2 /100 | #64 | Exceptional 87.9% |
| Immigrants | North America | 99.1 /100 | #65 | Exceptional 87.8% |
| Immigrants | Bulgaria | 99.1 /100 | #66 | Exceptional 87.8% |
| British | 99.1 /100 | #67 | Exceptional 87.8% |
| Immigrants | France | 99.1 /100 | #68 | Exceptional 87.8% |
| Immigrants | Saudi Arabia | 99.0 /100 | #69 | Exceptional 87.8% |
| Ukrainians | 98.8 /100 | #70 | Exceptional 87.7% |
| Austrians | 98.8 /100 | #71 | Exceptional 87.7% |
Demographics Similar to Chickasaw by GED/Equivalency
In terms of ged/equivalency, the demographic groups most similar to Chickasaw are Immigrants from Senegal (83.8%, a difference of 0.020%), Immigrants from Western Africa (83.8%, a difference of 0.030%), Immigrants from Ghana (83.9%, a difference of 0.050%), Blackfeet (83.8%, a difference of 0.050%), and Crow (83.8%, a difference of 0.050%).
| Demographics | Rating | Rank | GED/Equivalency |
| Immigrants | Bahamas | 2.6 /100 | #239 | Tragic 84.2% |
| Immigrants | South Eastern Asia | 2.5 /100 | #240 | Tragic 84.1% |
| Senegalese | 1.9 /100 | #241 | Tragic 84.0% |
| Sri Lankans | 1.9 /100 | #242 | Tragic 84.0% |
| Cherokee | 1.3 /100 | #243 | Tragic 83.9% |
| Immigrants | Ghana | 1.3 /100 | #244 | Tragic 83.9% |
| Immigrants | Senegal | 1.2 /100 | #245 | Tragic 83.8% |
| Chickasaw | 1.2 /100 | #246 | Tragic 83.8% |
| Immigrants | Western Africa | 1.1 /100 | #247 | Tragic 83.8% |
| Blackfeet | 1.1 /100 | #248 | Tragic 83.8% |
| Crow | 1.1 /100 | #249 | Tragic 83.8% |
| Shoshone | 1.0 /100 | #250 | Tragic 83.7% |
| Spanish Americans | 0.8 /100 | #251 | Tragic 83.6% |
| Bahamians | 0.8 /100 | #252 | Tragic 83.6% |
| Comanche | 0.7 /100 | #253 | Tragic 83.6% |