Immigrants from Belgium vs Comanche Disability Age 5 to 17
COMPARE
Immigrants from Belgium
Comanche
Disability Age 5 to 17
Disability Age 5 to 17 Comparison
Immigrants from Belgium
Comanche
5.2%
DISABILITY AGE 5 TO 17
99.7/ 100
METRIC RATING
70th/ 347
METRIC RANK
6.4%
DISABILITY AGE 5 TO 17
0.0/ 100
METRIC RATING
318th/ 347
METRIC RANK
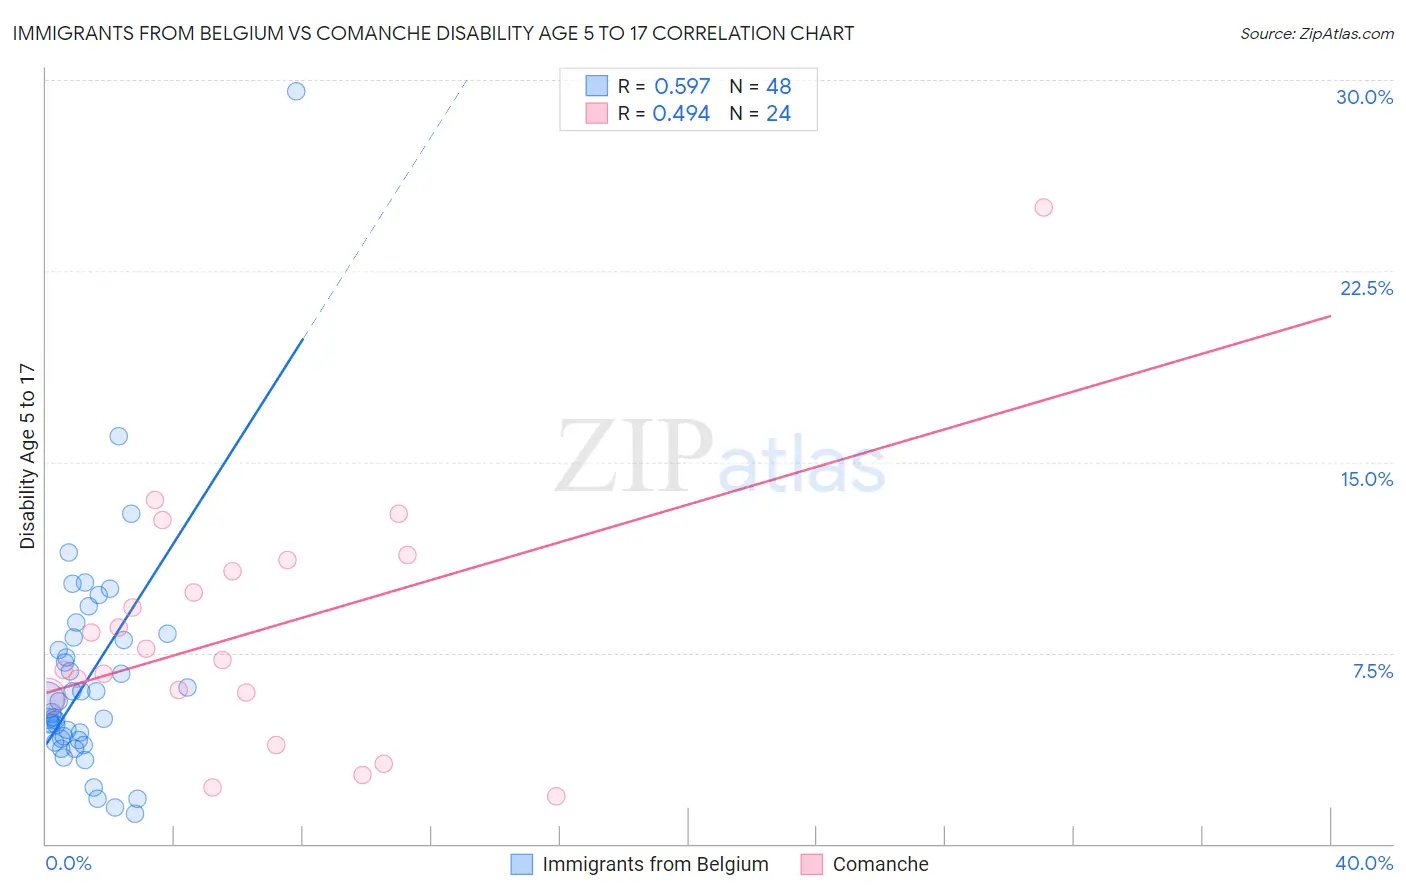
Immigrants from Belgium vs Comanche Disability Age 5 to 17 Correlation Chart
The statistical analysis conducted on geographies consisting of 146,050,104 people shows a substantial positive correlation between the proportion of Immigrants from Belgium and percentage of population with a disability between the ages 5 and 17 in the United States with a correlation coefficient (R) of 0.597 and weighted average of 5.2%. Similarly, the statistical analysis conducted on geographies consisting of 109,534,984 people shows a moderate positive correlation between the proportion of Comanche and percentage of population with a disability between the ages 5 and 17 in the United States with a correlation coefficient (R) of 0.494 and weighted average of 6.4%, a difference of 24.0%.
Disability Age 5 to 17 Correlation Summary
| Measurement | Immigrants from Belgium | Comanche |
| Minimum | 1.2% | 1.9% |
| Maximum | 29.6% | 25.0% |
| Range | 28.4% | 23.1% |
| Mean | 6.5% | 8.3% |
| Median | 5.4% | 7.4% |
| Interquartile 25% (IQ1) | 4.1% | 5.9% |
| Interquartile 75% (IQ3) | 8.0% | 10.9% |
| Interquartile Range (IQR) | 3.9% | 5.1% |
| Standard Deviation (Sample) | 4.6% | 4.9% |
| Standard Deviation (Population) | 4.5% | 4.8% |
Similar Demographics by Disability Age 5 to 17
Demographics Similar to Immigrants from Belgium by Disability Age 5 to 17
In terms of disability age 5 to 17, the demographic groups most similar to Immigrants from Belgium are Guyanese (5.2%, a difference of 0.040%), Jordanian (5.2%, a difference of 0.050%), Immigrants from Vietnam (5.2%, a difference of 0.070%), Immigrants from Czechoslovakia (5.2%, a difference of 0.090%), and Immigrants from Syria (5.2%, a difference of 0.15%).
| Demographics | Rating | Rank | Disability Age 5 to 17 |
| Immigrants | Bangladesh | 99.8 /100 | #63 | Exceptional 5.2% |
| Immigrants | South Eastern Asia | 99.8 /100 | #64 | Exceptional 5.2% |
| Immigrants | Greece | 99.8 /100 | #65 | Exceptional 5.2% |
| Palestinians | 99.8 /100 | #66 | Exceptional 5.2% |
| Macedonians | 99.8 /100 | #67 | Exceptional 5.2% |
| Immigrants | Syria | 99.7 /100 | #68 | Exceptional 5.2% |
| Guyanese | 99.7 /100 | #69 | Exceptional 5.2% |
| Immigrants | Belgium | 99.7 /100 | #70 | Exceptional 5.2% |
| Jordanians | 99.7 /100 | #71 | Exceptional 5.2% |
| Immigrants | Vietnam | 99.7 /100 | #72 | Exceptional 5.2% |
| Immigrants | Czechoslovakia | 99.7 /100 | #73 | Exceptional 5.2% |
| Immigrants | Romania | 99.7 /100 | #74 | Exceptional 5.2% |
| Immigrants | Moldova | 99.6 /100 | #75 | Exceptional 5.2% |
| Immigrants | Guyana | 99.6 /100 | #76 | Exceptional 5.2% |
| Immigrants | Kazakhstan | 99.6 /100 | #77 | Exceptional 5.2% |
Demographics Similar to Comanche by Disability Age 5 to 17
In terms of disability age 5 to 17, the demographic groups most similar to Comanche are Kiowa (6.4%, a difference of 0.030%), Immigrants from Dominican Republic (6.4%, a difference of 0.16%), Immigrants from Portugal (6.4%, a difference of 0.34%), French (6.4%, a difference of 0.51%), and Delaware (6.5%, a difference of 0.55%).
| Demographics | Rating | Rank | Disability Age 5 to 17 |
| Immigrants | Dominica | 0.0 /100 | #311 | Tragic 6.3% |
| Bermudans | 0.0 /100 | #312 | Tragic 6.4% |
| Apache | 0.0 /100 | #313 | Tragic 6.4% |
| French | 0.0 /100 | #314 | Tragic 6.4% |
| Immigrants | Portugal | 0.0 /100 | #315 | Tragic 6.4% |
| Immigrants | Dominican Republic | 0.0 /100 | #316 | Tragic 6.4% |
| Kiowa | 0.0 /100 | #317 | Tragic 6.4% |
| Comanche | 0.0 /100 | #318 | Tragic 6.4% |
| Delaware | 0.0 /100 | #319 | Tragic 6.5% |
| Africans | 0.0 /100 | #320 | Tragic 6.5% |
| Tohono O'odham | 0.0 /100 | #321 | Tragic 6.5% |
| Slovaks | 0.0 /100 | #322 | Tragic 6.5% |
| Osage | 0.0 /100 | #323 | Tragic 6.5% |
| Dominicans | 0.0 /100 | #324 | Tragic 6.5% |
| Americans | 0.0 /100 | #325 | Tragic 6.5% |