Immigrants from Belgium vs Luxembourger Disability Age 5 to 17
COMPARE
Immigrants from Belgium
Luxembourger
Disability Age 5 to 17
Disability Age 5 to 17 Comparison
Immigrants from Belgium
Luxembourgers
5.2%
DISABILITY AGE 5 TO 17
99.7/ 100
METRIC RATING
70th/ 347
METRIC RANK
5.3%
DISABILITY AGE 5 TO 17
99.2/ 100
METRIC RATING
92nd/ 347
METRIC RANK
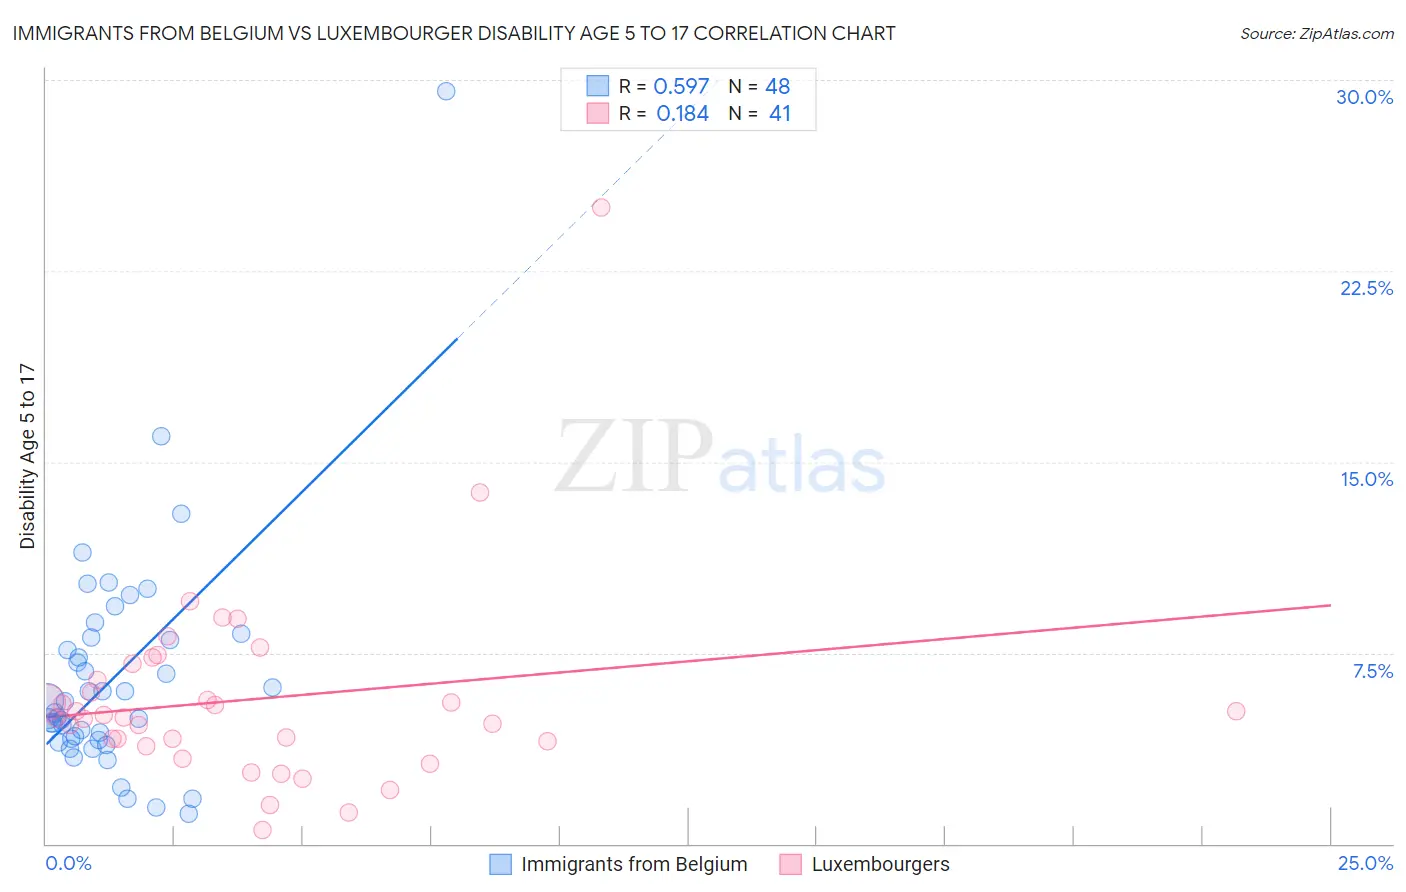
Immigrants from Belgium vs Luxembourger Disability Age 5 to 17 Correlation Chart
The statistical analysis conducted on geographies consisting of 146,050,104 people shows a substantial positive correlation between the proportion of Immigrants from Belgium and percentage of population with a disability between the ages 5 and 17 in the United States with a correlation coefficient (R) of 0.597 and weighted average of 5.2%. Similarly, the statistical analysis conducted on geographies consisting of 143,736,782 people shows a poor positive correlation between the proportion of Luxembourgers and percentage of population with a disability between the ages 5 and 17 in the United States with a correlation coefficient (R) of 0.184 and weighted average of 5.3%, a difference of 1.4%.
Disability Age 5 to 17 Correlation Summary
| Measurement | Immigrants from Belgium | Luxembourger |
| Minimum | 1.2% | 0.53% |
| Maximum | 29.6% | 25.0% |
| Range | 28.4% | 24.5% |
| Mean | 6.5% | 5.7% |
| Median | 5.4% | 5.0% |
| Interquartile 25% (IQ1) | 4.1% | 3.9% |
| Interquartile 75% (IQ3) | 8.0% | 6.8% |
| Interquartile Range (IQR) | 3.9% | 2.8% |
| Standard Deviation (Sample) | 4.6% | 4.0% |
| Standard Deviation (Population) | 4.5% | 3.9% |
Similar Demographics by Disability Age 5 to 17
Demographics Similar to Immigrants from Belgium by Disability Age 5 to 17
In terms of disability age 5 to 17, the demographic groups most similar to Immigrants from Belgium are Guyanese (5.2%, a difference of 0.040%), Jordanian (5.2%, a difference of 0.050%), Immigrants from Vietnam (5.2%, a difference of 0.070%), Immigrants from Czechoslovakia (5.2%, a difference of 0.090%), and Immigrants from Syria (5.2%, a difference of 0.15%).
| Demographics | Rating | Rank | Disability Age 5 to 17 |
| Immigrants | Bangladesh | 99.8 /100 | #63 | Exceptional 5.2% |
| Immigrants | South Eastern Asia | 99.8 /100 | #64 | Exceptional 5.2% |
| Immigrants | Greece | 99.8 /100 | #65 | Exceptional 5.2% |
| Palestinians | 99.8 /100 | #66 | Exceptional 5.2% |
| Macedonians | 99.8 /100 | #67 | Exceptional 5.2% |
| Immigrants | Syria | 99.7 /100 | #68 | Exceptional 5.2% |
| Guyanese | 99.7 /100 | #69 | Exceptional 5.2% |
| Immigrants | Belgium | 99.7 /100 | #70 | Exceptional 5.2% |
| Jordanians | 99.7 /100 | #71 | Exceptional 5.2% |
| Immigrants | Vietnam | 99.7 /100 | #72 | Exceptional 5.2% |
| Immigrants | Czechoslovakia | 99.7 /100 | #73 | Exceptional 5.2% |
| Immigrants | Romania | 99.7 /100 | #74 | Exceptional 5.2% |
| Immigrants | Moldova | 99.6 /100 | #75 | Exceptional 5.2% |
| Immigrants | Guyana | 99.6 /100 | #76 | Exceptional 5.2% |
| Immigrants | Kazakhstan | 99.6 /100 | #77 | Exceptional 5.2% |
Demographics Similar to Luxembourgers by Disability Age 5 to 17
In terms of disability age 5 to 17, the demographic groups most similar to Luxembourgers are Mongolian (5.3%, a difference of 0.010%), Immigrants from Peru (5.3%, a difference of 0.080%), Immigrants from Jordan (5.3%, a difference of 0.14%), Immigrants from Grenada (5.3%, a difference of 0.16%), and Immigrants from Kuwait (5.3%, a difference of 0.30%).
| Demographics | Rating | Rank | Disability Age 5 to 17 |
| Bulgarians | 99.4 /100 | #85 | Exceptional 5.2% |
| Immigrants | St. Vincent and the Grenadines | 99.4 /100 | #86 | Exceptional 5.2% |
| Eastern Europeans | 99.4 /100 | #87 | Exceptional 5.2% |
| Immigrants | Croatia | 99.4 /100 | #88 | Exceptional 5.2% |
| Immigrants | Spain | 99.4 /100 | #89 | Exceptional 5.2% |
| Immigrants | Kuwait | 99.4 /100 | #90 | Exceptional 5.3% |
| Mongolians | 99.2 /100 | #91 | Exceptional 5.3% |
| Luxembourgers | 99.2 /100 | #92 | Exceptional 5.3% |
| Immigrants | Peru | 99.1 /100 | #93 | Exceptional 5.3% |
| Immigrants | Jordan | 99.1 /100 | #94 | Exceptional 5.3% |
| Immigrants | Grenada | 99.1 /100 | #95 | Exceptional 5.3% |
| Immigrants | El Salvador | 99.0 /100 | #96 | Exceptional 5.3% |
| Immigrants | Europe | 99.0 /100 | #97 | Exceptional 5.3% |
| Immigrants | Austria | 98.9 /100 | #98 | Exceptional 5.3% |
| Cambodians | 98.8 /100 | #99 | Exceptional 5.3% |