Immigrants from Belgium vs Comanche Unemployment
COMPARE
Immigrants from Belgium
Comanche
Unemployment
Unemployment Comparison
Immigrants from Belgium
Comanche
4.9%
UNEMPLOYMENT
99.2/ 100
METRIC RATING
51st/ 347
METRIC RANK
5.5%
UNEMPLOYMENT
4.9/ 100
METRIC RATING
232nd/ 347
METRIC RANK
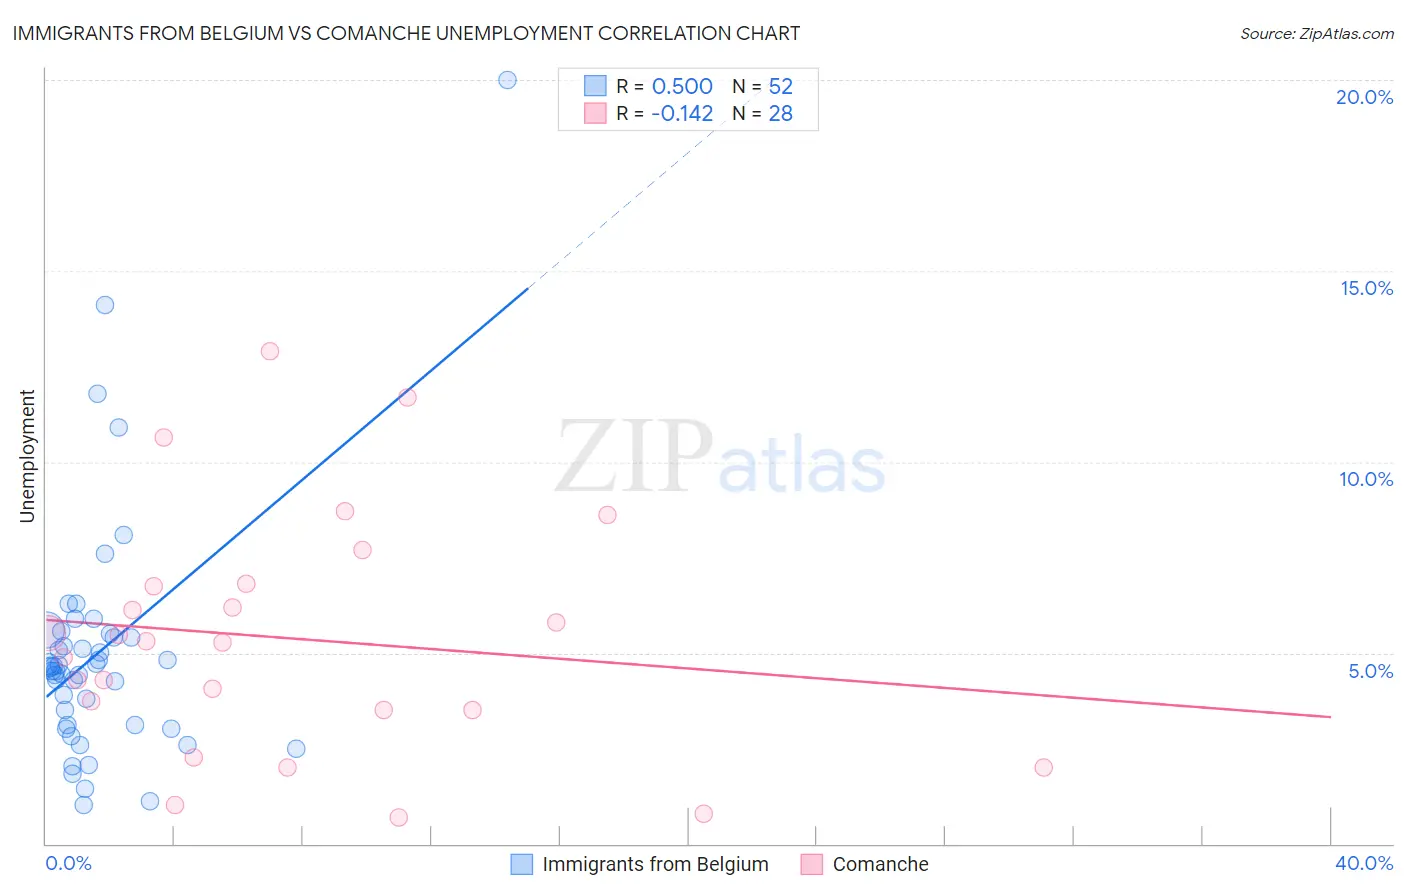
Immigrants from Belgium vs Comanche Unemployment Correlation Chart
The statistical analysis conducted on geographies consisting of 146,688,152 people shows a substantial positive correlation between the proportion of Immigrants from Belgium and unemployment in the United States with a correlation coefficient (R) of 0.500 and weighted average of 4.9%. Similarly, the statistical analysis conducted on geographies consisting of 109,712,391 people shows a poor negative correlation between the proportion of Comanche and unemployment in the United States with a correlation coefficient (R) of -0.142 and weighted average of 5.5%, a difference of 13.0%.
Unemployment Correlation Summary
| Measurement | Immigrants from Belgium | Comanche |
| Minimum | 1.0% | 0.70% |
| Maximum | 20.0% | 12.9% |
| Range | 19.0% | 12.2% |
| Mean | 5.0% | 5.4% |
| Median | 4.6% | 5.3% |
| Interquartile 25% (IQ1) | 3.1% | 3.5% |
| Interquartile 75% (IQ3) | 5.4% | 6.8% |
| Interquartile Range (IQR) | 2.3% | 3.3% |
| Standard Deviation (Sample) | 3.2% | 3.1% |
| Standard Deviation (Population) | 3.2% | 3.1% |
Similar Demographics by Unemployment
Demographics Similar to Immigrants from Belgium by Unemployment
In terms of unemployment, the demographic groups most similar to Immigrants from Belgium are White/Caucasian (4.9%, a difference of 0.010%), Immigrants from Zimbabwe (4.9%, a difference of 0.040%), Eastern European (4.9%, a difference of 0.070%), Australian (4.9%, a difference of 0.10%), and French Canadian (4.9%, a difference of 0.16%).
| Demographics | Rating | Rank | Unemployment |
| Austrians | 99.5 /100 | #44 | Exceptional 4.8% |
| French | 99.5 /100 | #45 | Exceptional 4.8% |
| Immigrants | Nepal | 99.4 /100 | #46 | Exceptional 4.8% |
| Immigrants | Taiwan | 99.4 /100 | #47 | Exceptional 4.8% |
| Immigrants | Scotland | 99.3 /100 | #48 | Exceptional 4.9% |
| Immigrants | South Central Asia | 99.3 /100 | #49 | Exceptional 4.9% |
| French Canadians | 99.3 /100 | #50 | Exceptional 4.9% |
| Immigrants | Belgium | 99.2 /100 | #51 | Exceptional 4.9% |
| Whites/Caucasians | 99.2 /100 | #52 | Exceptional 4.9% |
| Immigrants | Zimbabwe | 99.2 /100 | #53 | Exceptional 4.9% |
| Eastern Europeans | 99.2 /100 | #54 | Exceptional 4.9% |
| Australians | 99.2 /100 | #55 | Exceptional 4.9% |
| Celtics | 99.1 /100 | #56 | Exceptional 4.9% |
| Immigrants | Singapore | 99.1 /100 | #57 | Exceptional 4.9% |
| Greeks | 99.0 /100 | #58 | Exceptional 4.9% |
Demographics Similar to Comanche by Unemployment
In terms of unemployment, the demographic groups most similar to Comanche are Immigrants from Africa (5.5%, a difference of 0.0%), Immigrants from Syria (5.5%, a difference of 0.050%), Panamanian (5.5%, a difference of 0.080%), Hawaiian (5.5%, a difference of 0.13%), and Ottawa (5.5%, a difference of 0.13%).
| Demographics | Rating | Rank | Unemployment |
| South American Indians | 7.8 /100 | #225 | Tragic 5.5% |
| Samoans | 7.1 /100 | #226 | Tragic 5.5% |
| Immigrants | Lebanon | 7.0 /100 | #227 | Tragic 5.5% |
| Guamanians/Chamorros | 6.3 /100 | #228 | Tragic 5.5% |
| Hawaiians | 5.4 /100 | #229 | Tragic 5.5% |
| Ottawa | 5.4 /100 | #230 | Tragic 5.5% |
| Immigrants | Africa | 4.9 /100 | #231 | Tragic 5.5% |
| Comanche | 4.9 /100 | #232 | Tragic 5.5% |
| Immigrants | Syria | 4.8 /100 | #233 | Tragic 5.5% |
| Panamanians | 4.7 /100 | #234 | Tragic 5.5% |
| Immigrants | Panama | 3.4 /100 | #235 | Tragic 5.5% |
| Immigrants | Cambodia | 3.3 /100 | #236 | Tragic 5.5% |
| Moroccans | 3.2 /100 | #237 | Tragic 5.5% |
| Immigrants | Western Asia | 2.8 /100 | #238 | Tragic 5.5% |
| Immigrants | Immigrants | 2.6 /100 | #239 | Tragic 5.5% |