Bahamian vs Comanche Disability Age 5 to 17
COMPARE
Bahamian
Comanche
Disability Age 5 to 17
Disability Age 5 to 17 Comparison
Bahamians
Comanche
6.3%
DISABILITY AGE 5 TO 17
0.0/ 100
METRIC RATING
307th/ 347
METRIC RANK
6.4%
DISABILITY AGE 5 TO 17
0.0/ 100
METRIC RATING
318th/ 347
METRIC RANK
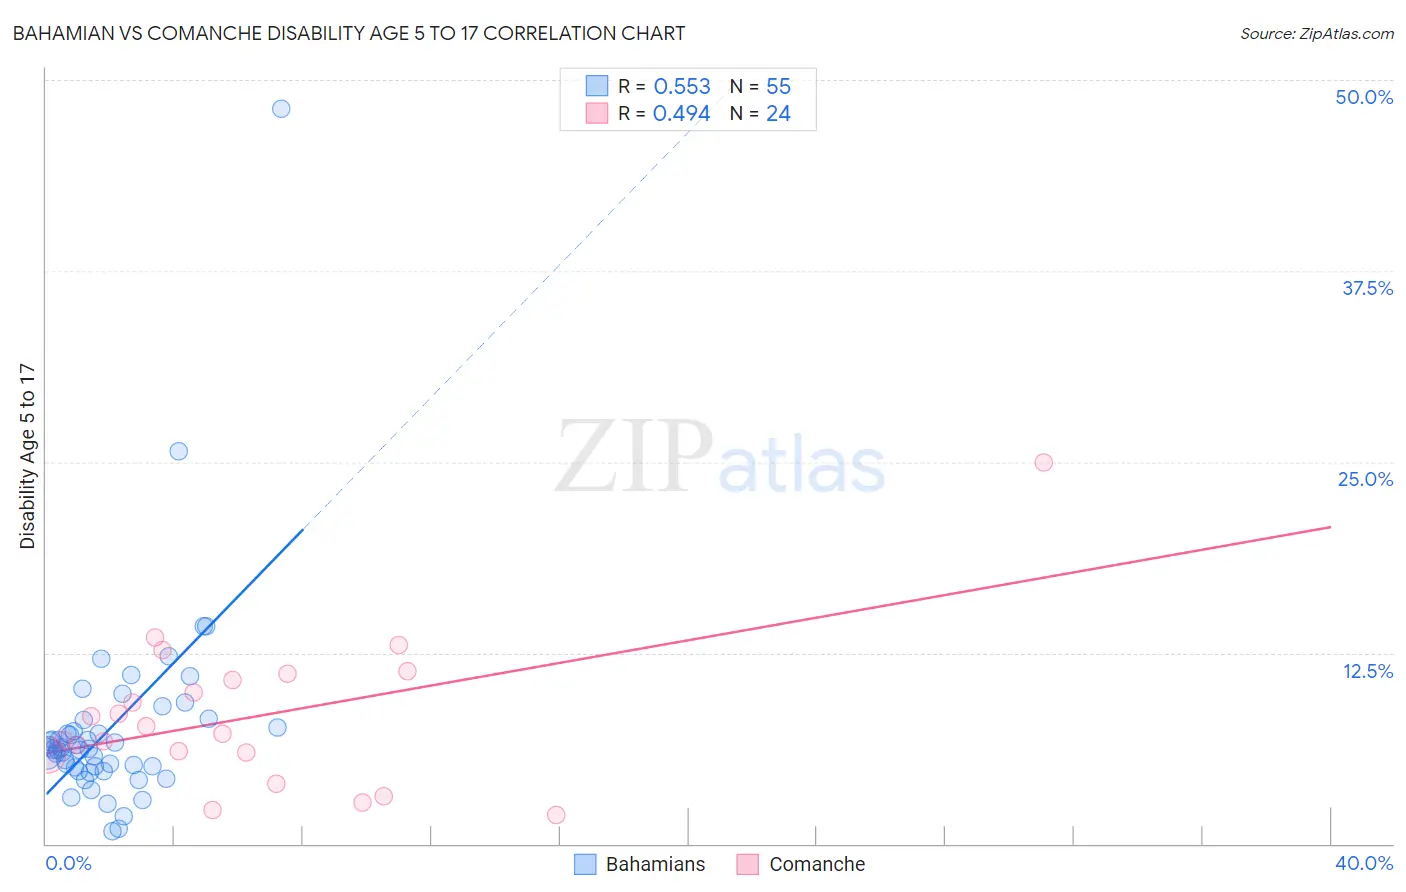
Bahamian vs Comanche Disability Age 5 to 17 Correlation Chart
The statistical analysis conducted on geographies consisting of 112,302,406 people shows a substantial positive correlation between the proportion of Bahamians and percentage of population with a disability between the ages 5 and 17 in the United States with a correlation coefficient (R) of 0.553 and weighted average of 6.3%. Similarly, the statistical analysis conducted on geographies consisting of 109,534,984 people shows a moderate positive correlation between the proportion of Comanche and percentage of population with a disability between the ages 5 and 17 in the United States with a correlation coefficient (R) of 0.494 and weighted average of 6.4%, a difference of 2.0%.
Disability Age 5 to 17 Correlation Summary
| Measurement | Bahamian | Comanche |
| Minimum | 0.80% | 1.9% |
| Maximum | 48.1% | 25.0% |
| Range | 47.4% | 23.1% |
| Mean | 7.6% | 8.3% |
| Median | 6.2% | 7.4% |
| Interquartile 25% (IQ1) | 5.0% | 5.9% |
| Interquartile 75% (IQ3) | 8.1% | 10.9% |
| Interquartile Range (IQR) | 3.1% | 5.1% |
| Standard Deviation (Sample) | 6.8% | 4.9% |
| Standard Deviation (Population) | 6.7% | 4.8% |
Demographics Similar to Bahamians and Comanche by Disability Age 5 to 17
In terms of disability age 5 to 17, the demographic groups most similar to Bahamians are Nonimmigrants (6.3%, a difference of 0.14%), Scotch-Irish (6.3%, a difference of 0.23%), Native/Alaskan (6.3%, a difference of 0.24%), Hmong (6.3%, a difference of 0.26%), and Senegalese (6.3%, a difference of 0.38%). Similarly, the demographic groups most similar to Comanche are Kiowa (6.4%, a difference of 0.030%), Immigrants from Dominican Republic (6.4%, a difference of 0.16%), Immigrants from Portugal (6.4%, a difference of 0.34%), French (6.4%, a difference of 0.51%), and Delaware (6.5%, a difference of 0.55%).
| Demographics | Rating | Rank | Disability Age 5 to 17 |
| Celtics | 0.0 /100 | #302 | Tragic 6.3% |
| Yakama | 0.0 /100 | #303 | Tragic 6.3% |
| Senegalese | 0.0 /100 | #304 | Tragic 6.3% |
| Natives/Alaskans | 0.0 /100 | #305 | Tragic 6.3% |
| Immigrants | Nonimmigrants | 0.0 /100 | #306 | Tragic 6.3% |
| Bahamians | 0.0 /100 | #307 | Tragic 6.3% |
| Scotch-Irish | 0.0 /100 | #308 | Tragic 6.3% |
| Hmong | 0.0 /100 | #309 | Tragic 6.3% |
| Alaskan Athabascans | 0.0 /100 | #310 | Tragic 6.3% |
| Immigrants | Dominica | 0.0 /100 | #311 | Tragic 6.3% |
| Bermudans | 0.0 /100 | #312 | Tragic 6.4% |
| Apache | 0.0 /100 | #313 | Tragic 6.4% |
| French | 0.0 /100 | #314 | Tragic 6.4% |
| Immigrants | Portugal | 0.0 /100 | #315 | Tragic 6.4% |
| Immigrants | Dominican Republic | 0.0 /100 | #316 | Tragic 6.4% |
| Kiowa | 0.0 /100 | #317 | Tragic 6.4% |
| Comanche | 0.0 /100 | #318 | Tragic 6.4% |
| Delaware | 0.0 /100 | #319 | Tragic 6.5% |
| Africans | 0.0 /100 | #320 | Tragic 6.5% |
| Tohono O'odham | 0.0 /100 | #321 | Tragic 6.5% |
| Slovaks | 0.0 /100 | #322 | Tragic 6.5% |