Okinawan vs Comanche Disability Age 5 to 17
COMPARE
Okinawan
Comanche
Disability Age 5 to 17
Disability Age 5 to 17 Comparison
Okinawans
Comanche
5.0%
DISABILITY AGE 5 TO 17
100.0/ 100
METRIC RATING
40th/ 347
METRIC RANK
6.4%
DISABILITY AGE 5 TO 17
0.0/ 100
METRIC RATING
318th/ 347
METRIC RANK
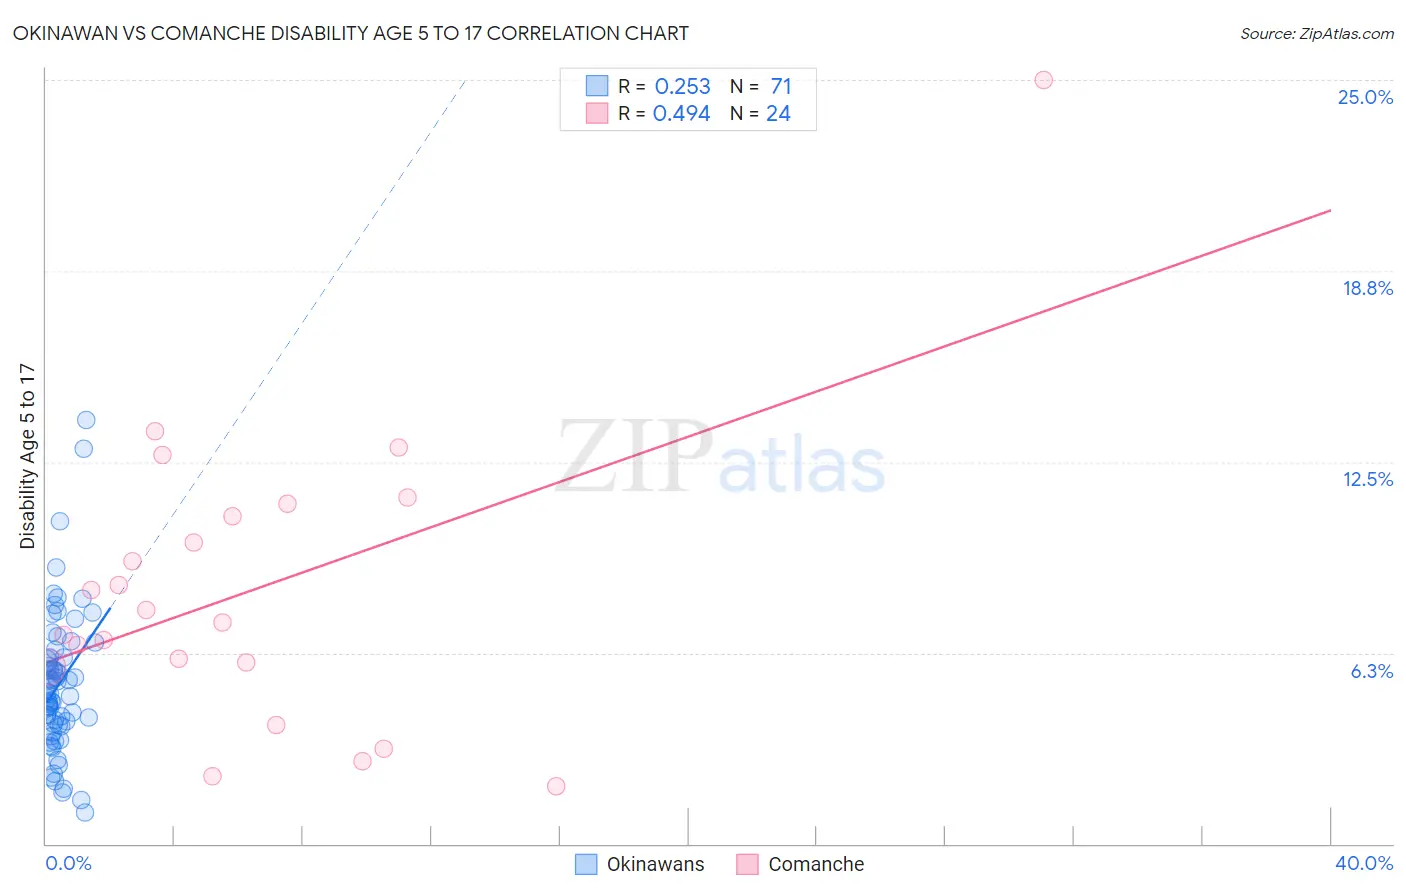
Okinawan vs Comanche Disability Age 5 to 17 Correlation Chart
The statistical analysis conducted on geographies consisting of 73,585,145 people shows a weak positive correlation between the proportion of Okinawans and percentage of population with a disability between the ages 5 and 17 in the United States with a correlation coefficient (R) of 0.253 and weighted average of 5.0%. Similarly, the statistical analysis conducted on geographies consisting of 109,534,984 people shows a moderate positive correlation between the proportion of Comanche and percentage of population with a disability between the ages 5 and 17 in the United States with a correlation coefficient (R) of 0.494 and weighted average of 6.4%, a difference of 28.5%.
Disability Age 5 to 17 Correlation Summary
| Measurement | Okinawan | Comanche |
| Minimum | 1.0% | 1.9% |
| Maximum | 13.9% | 25.0% |
| Range | 12.8% | 23.1% |
| Mean | 5.2% | 8.3% |
| Median | 4.9% | 7.4% |
| Interquartile 25% (IQ1) | 3.9% | 5.9% |
| Interquartile 75% (IQ3) | 6.1% | 10.9% |
| Interquartile Range (IQR) | 2.2% | 5.1% |
| Standard Deviation (Sample) | 2.3% | 4.9% |
| Standard Deviation (Population) | 2.3% | 4.8% |
Similar Demographics by Disability Age 5 to 17
Demographics Similar to Okinawans by Disability Age 5 to 17
In terms of disability age 5 to 17, the demographic groups most similar to Okinawans are Immigrants from Argentina (5.0%, a difference of 0.080%), Immigrants from Australia (5.0%, a difference of 0.080%), Immigrants from Philippines (5.0%, a difference of 0.090%), Immigrants from Sri Lanka (5.0%, a difference of 0.090%), and Immigrants from Belarus (5.0%, a difference of 0.13%).
| Demographics | Rating | Rank | Disability Age 5 to 17 |
| Immigrants | Indonesia | 100.0 /100 | #33 | Exceptional 5.0% |
| Israelis | 100.0 /100 | #34 | Exceptional 5.0% |
| Bolivians | 100.0 /100 | #35 | Exceptional 5.0% |
| Immigrants | Egypt | 100.0 /100 | #36 | Exceptional 5.0% |
| Immigrants | Belarus | 100.0 /100 | #37 | Exceptional 5.0% |
| Immigrants | Philippines | 100.0 /100 | #38 | Exceptional 5.0% |
| Immigrants | Argentina | 100.0 /100 | #39 | Exceptional 5.0% |
| Okinawans | 100.0 /100 | #40 | Exceptional 5.0% |
| Immigrants | Australia | 100.0 /100 | #41 | Exceptional 5.0% |
| Immigrants | Sri Lanka | 100.0 /100 | #42 | Exceptional 5.0% |
| Immigrants | Russia | 100.0 /100 | #43 | Exceptional 5.0% |
| Egyptians | 100.0 /100 | #44 | Exceptional 5.0% |
| Tongans | 100.0 /100 | #45 | Exceptional 5.0% |
| Assyrians/Chaldeans/Syriacs | 100.0 /100 | #46 | Exceptional 5.0% |
| Vietnamese | 100.0 /100 | #47 | Exceptional 5.1% |
Demographics Similar to Comanche by Disability Age 5 to 17
In terms of disability age 5 to 17, the demographic groups most similar to Comanche are Kiowa (6.4%, a difference of 0.030%), Immigrants from Dominican Republic (6.4%, a difference of 0.16%), Immigrants from Portugal (6.4%, a difference of 0.34%), French (6.4%, a difference of 0.51%), and Delaware (6.5%, a difference of 0.55%).
| Demographics | Rating | Rank | Disability Age 5 to 17 |
| Immigrants | Dominica | 0.0 /100 | #311 | Tragic 6.3% |
| Bermudans | 0.0 /100 | #312 | Tragic 6.4% |
| Apache | 0.0 /100 | #313 | Tragic 6.4% |
| French | 0.0 /100 | #314 | Tragic 6.4% |
| Immigrants | Portugal | 0.0 /100 | #315 | Tragic 6.4% |
| Immigrants | Dominican Republic | 0.0 /100 | #316 | Tragic 6.4% |
| Kiowa | 0.0 /100 | #317 | Tragic 6.4% |
| Comanche | 0.0 /100 | #318 | Tragic 6.4% |
| Delaware | 0.0 /100 | #319 | Tragic 6.5% |
| Africans | 0.0 /100 | #320 | Tragic 6.5% |
| Tohono O'odham | 0.0 /100 | #321 | Tragic 6.5% |
| Slovaks | 0.0 /100 | #322 | Tragic 6.5% |
| Osage | 0.0 /100 | #323 | Tragic 6.5% |
| Dominicans | 0.0 /100 | #324 | Tragic 6.5% |
| Americans | 0.0 /100 | #325 | Tragic 6.5% |