Immigrants from Mexico vs Comanche Disability Age 5 to 17
COMPARE
Immigrants from Mexico
Comanche
Disability Age 5 to 17
Disability Age 5 to 17 Comparison
Immigrants from Mexico
Comanche
5.6%
DISABILITY AGE 5 TO 17
33.7/ 100
METRIC RATING
185th/ 347
METRIC RANK
6.4%
DISABILITY AGE 5 TO 17
0.0/ 100
METRIC RATING
318th/ 347
METRIC RANK
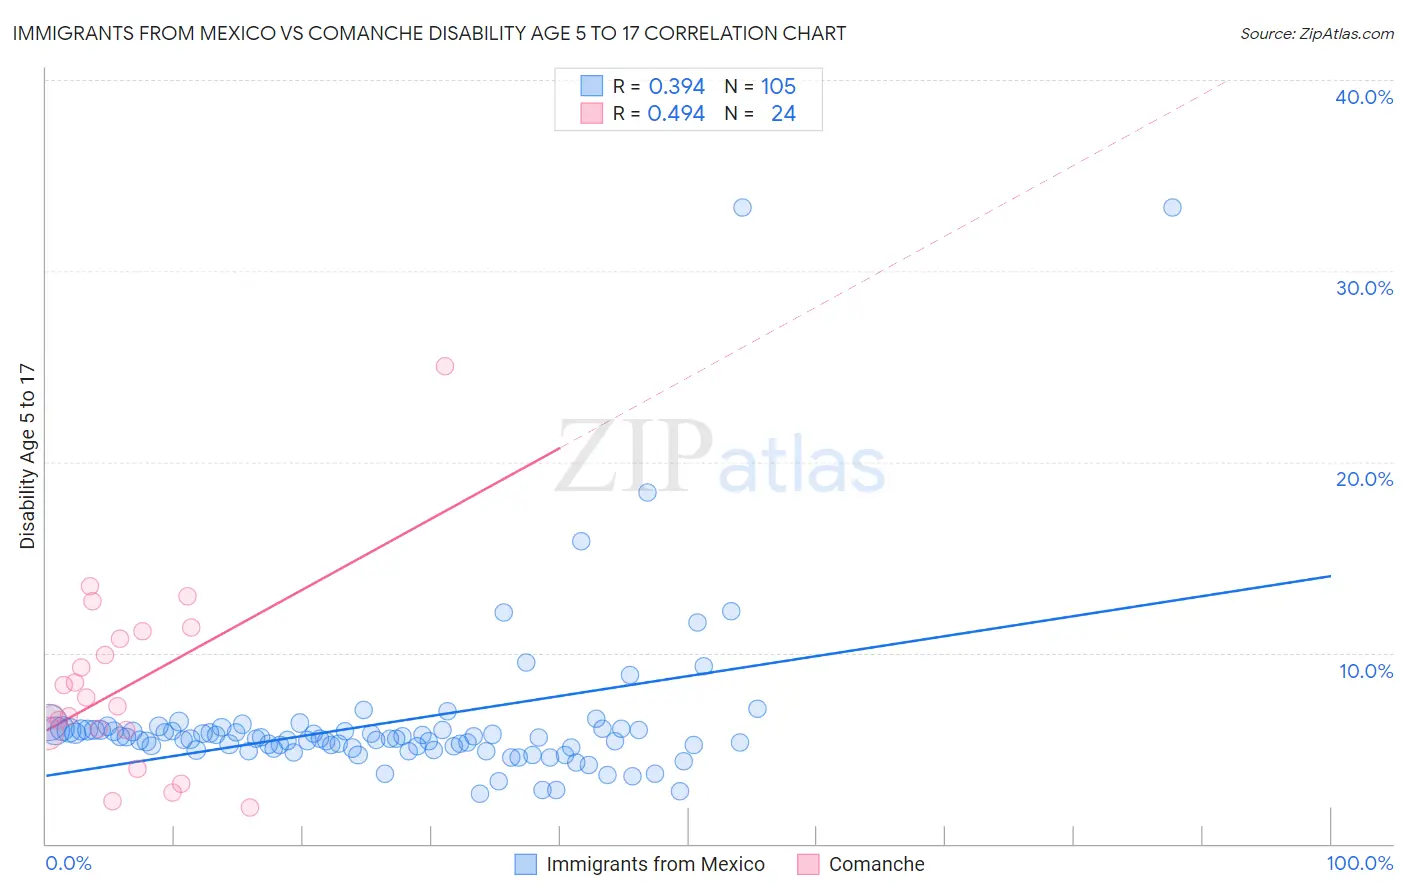
Immigrants from Mexico vs Comanche Disability Age 5 to 17 Correlation Chart
The statistical analysis conducted on geographies consisting of 506,254,859 people shows a mild positive correlation between the proportion of Immigrants from Mexico and percentage of population with a disability between the ages 5 and 17 in the United States with a correlation coefficient (R) of 0.394 and weighted average of 5.6%. Similarly, the statistical analysis conducted on geographies consisting of 109,534,984 people shows a moderate positive correlation between the proportion of Comanche and percentage of population with a disability between the ages 5 and 17 in the United States with a correlation coefficient (R) of 0.494 and weighted average of 6.4%, a difference of 14.1%.
Disability Age 5 to 17 Correlation Summary
| Measurement | Immigrants from Mexico | Comanche |
| Minimum | 2.6% | 1.9% |
| Maximum | 33.3% | 25.0% |
| Range | 30.7% | 23.1% |
| Mean | 6.4% | 8.3% |
| Median | 5.5% | 7.4% |
| Interquartile 25% (IQ1) | 5.0% | 5.9% |
| Interquartile 75% (IQ3) | 6.0% | 10.9% |
| Interquartile Range (IQR) | 0.96% | 5.1% |
| Standard Deviation (Sample) | 4.4% | 4.9% |
| Standard Deviation (Population) | 4.4% | 4.8% |
Similar Demographics by Disability Age 5 to 17
Demographics Similar to Immigrants from Mexico by Disability Age 5 to 17
In terms of disability age 5 to 17, the demographic groups most similar to Immigrants from Mexico are Syrian (5.6%, a difference of 0.010%), Immigrants from Latin America (5.6%, a difference of 0.030%), Mexican American Indian (5.6%, a difference of 0.080%), Fijian (5.7%, a difference of 0.11%), and Immigrants from England (5.6%, a difference of 0.14%).
| Demographics | Rating | Rank | Disability Age 5 to 17 |
| Immigrants | Trinidad and Tobago | 47.6 /100 | #178 | Average 5.6% |
| Immigrants | Barbados | 40.5 /100 | #179 | Average 5.6% |
| Immigrants | Uruguay | 37.7 /100 | #180 | Fair 5.6% |
| Immigrants | England | 36.4 /100 | #181 | Fair 5.6% |
| Mexican American Indians | 35.2 /100 | #182 | Fair 5.6% |
| Immigrants | Latin America | 34.3 /100 | #183 | Fair 5.6% |
| Syrians | 33.8 /100 | #184 | Fair 5.6% |
| Immigrants | Mexico | 33.7 /100 | #185 | Fair 5.6% |
| Fijians | 31.7 /100 | #186 | Fair 5.7% |
| Immigrants | Thailand | 30.2 /100 | #187 | Fair 5.7% |
| Marshallese | 28.1 /100 | #188 | Fair 5.7% |
| Pueblo | 27.5 /100 | #189 | Fair 5.7% |
| Immigrants | Eastern Africa | 27.3 /100 | #190 | Fair 5.7% |
| Danes | 26.5 /100 | #191 | Fair 5.7% |
| Immigrants | Bosnia and Herzegovina | 26.3 /100 | #192 | Fair 5.7% |
Demographics Similar to Comanche by Disability Age 5 to 17
In terms of disability age 5 to 17, the demographic groups most similar to Comanche are Kiowa (6.4%, a difference of 0.030%), Immigrants from Dominican Republic (6.4%, a difference of 0.16%), Immigrants from Portugal (6.4%, a difference of 0.34%), French (6.4%, a difference of 0.51%), and Delaware (6.5%, a difference of 0.55%).
| Demographics | Rating | Rank | Disability Age 5 to 17 |
| Immigrants | Dominica | 0.0 /100 | #311 | Tragic 6.3% |
| Bermudans | 0.0 /100 | #312 | Tragic 6.4% |
| Apache | 0.0 /100 | #313 | Tragic 6.4% |
| French | 0.0 /100 | #314 | Tragic 6.4% |
| Immigrants | Portugal | 0.0 /100 | #315 | Tragic 6.4% |
| Immigrants | Dominican Republic | 0.0 /100 | #316 | Tragic 6.4% |
| Kiowa | 0.0 /100 | #317 | Tragic 6.4% |
| Comanche | 0.0 /100 | #318 | Tragic 6.4% |
| Delaware | 0.0 /100 | #319 | Tragic 6.5% |
| Africans | 0.0 /100 | #320 | Tragic 6.5% |
| Tohono O'odham | 0.0 /100 | #321 | Tragic 6.5% |
| Slovaks | 0.0 /100 | #322 | Tragic 6.5% |
| Osage | 0.0 /100 | #323 | Tragic 6.5% |
| Dominicans | 0.0 /100 | #324 | Tragic 6.5% |
| Americans | 0.0 /100 | #325 | Tragic 6.5% |