Immigrants from Belgium vs Indonesian Disability Age 5 to 17
COMPARE
Immigrants from Belgium
Indonesian
Disability Age 5 to 17
Disability Age 5 to 17 Comparison
Immigrants from Belgium
Indonesians
5.2%
DISABILITY AGE 5 TO 17
99.7/ 100
METRIC RATING
70th/ 347
METRIC RANK
5.9%
DISABILITY AGE 5 TO 17
2.0/ 100
METRIC RATING
243rd/ 347
METRIC RANK
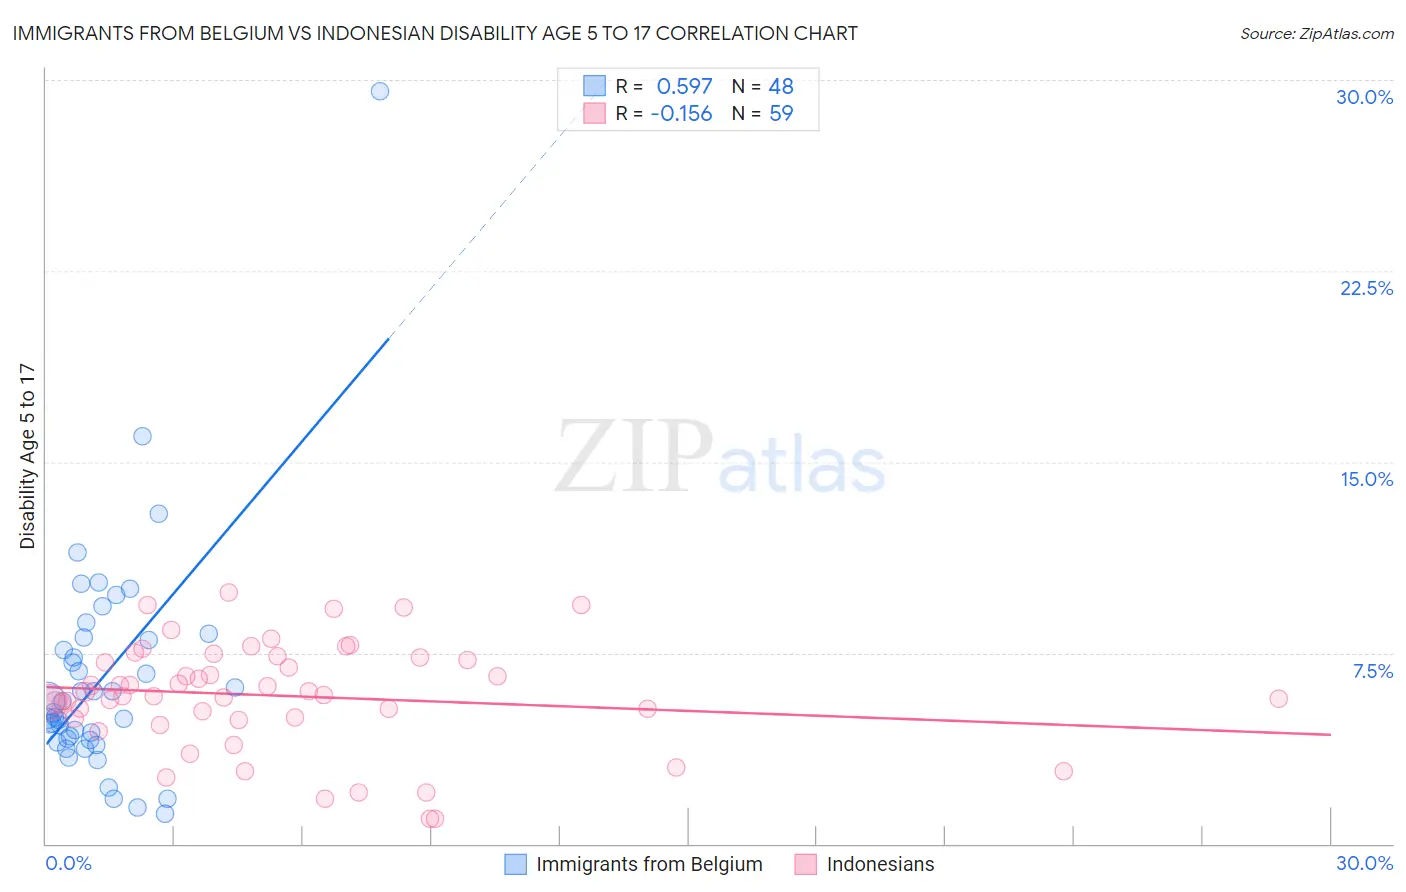
Immigrants from Belgium vs Indonesian Disability Age 5 to 17 Correlation Chart
The statistical analysis conducted on geographies consisting of 146,050,104 people shows a substantial positive correlation between the proportion of Immigrants from Belgium and percentage of population with a disability between the ages 5 and 17 in the United States with a correlation coefficient (R) of 0.597 and weighted average of 5.2%. Similarly, the statistical analysis conducted on geographies consisting of 162,352,811 people shows a poor negative correlation between the proportion of Indonesians and percentage of population with a disability between the ages 5 and 17 in the United States with a correlation coefficient (R) of -0.156 and weighted average of 5.9%, a difference of 13.0%.
Disability Age 5 to 17 Correlation Summary
| Measurement | Immigrants from Belgium | Indonesian |
| Minimum | 1.2% | 0.98% |
| Maximum | 29.6% | 9.9% |
| Range | 28.4% | 8.9% |
| Mean | 6.5% | 5.8% |
| Median | 5.4% | 5.8% |
| Interquartile 25% (IQ1) | 4.1% | 4.9% |
| Interquartile 75% (IQ3) | 8.0% | 7.3% |
| Interquartile Range (IQR) | 3.9% | 2.4% |
| Standard Deviation (Sample) | 4.6% | 2.1% |
| Standard Deviation (Population) | 4.5% | 2.1% |
Similar Demographics by Disability Age 5 to 17
Demographics Similar to Immigrants from Belgium by Disability Age 5 to 17
In terms of disability age 5 to 17, the demographic groups most similar to Immigrants from Belgium are Guyanese (5.2%, a difference of 0.040%), Jordanian (5.2%, a difference of 0.050%), Immigrants from Vietnam (5.2%, a difference of 0.070%), Immigrants from Czechoslovakia (5.2%, a difference of 0.090%), and Immigrants from Syria (5.2%, a difference of 0.15%).
| Demographics | Rating | Rank | Disability Age 5 to 17 |
| Immigrants | Bangladesh | 99.8 /100 | #63 | Exceptional 5.2% |
| Immigrants | South Eastern Asia | 99.8 /100 | #64 | Exceptional 5.2% |
| Immigrants | Greece | 99.8 /100 | #65 | Exceptional 5.2% |
| Palestinians | 99.8 /100 | #66 | Exceptional 5.2% |
| Macedonians | 99.8 /100 | #67 | Exceptional 5.2% |
| Immigrants | Syria | 99.7 /100 | #68 | Exceptional 5.2% |
| Guyanese | 99.7 /100 | #69 | Exceptional 5.2% |
| Immigrants | Belgium | 99.7 /100 | #70 | Exceptional 5.2% |
| Jordanians | 99.7 /100 | #71 | Exceptional 5.2% |
| Immigrants | Vietnam | 99.7 /100 | #72 | Exceptional 5.2% |
| Immigrants | Czechoslovakia | 99.7 /100 | #73 | Exceptional 5.2% |
| Immigrants | Romania | 99.7 /100 | #74 | Exceptional 5.2% |
| Immigrants | Moldova | 99.6 /100 | #75 | Exceptional 5.2% |
| Immigrants | Guyana | 99.6 /100 | #76 | Exceptional 5.2% |
| Immigrants | Kazakhstan | 99.6 /100 | #77 | Exceptional 5.2% |
Demographics Similar to Indonesians by Disability Age 5 to 17
In terms of disability age 5 to 17, the demographic groups most similar to Indonesians are Spaniard (5.9%, a difference of 0.010%), Immigrants from Germany (5.9%, a difference of 0.060%), Immigrants from Micronesia (5.9%, a difference of 0.060%), Tlingit-Haida (5.9%, a difference of 0.060%), and Immigrants from Caribbean (5.9%, a difference of 0.090%).
| Demographics | Rating | Rank | Disability Age 5 to 17 |
| Immigrants | Brazil | 3.2 /100 | #236 | Tragic 5.8% |
| Sudanese | 2.9 /100 | #237 | Tragic 5.8% |
| Hungarians | 2.6 /100 | #238 | Tragic 5.8% |
| German Russians | 2.4 /100 | #239 | Tragic 5.9% |
| West Indians | 2.4 /100 | #240 | Tragic 5.9% |
| Immigrants | Caribbean | 2.1 /100 | #241 | Tragic 5.9% |
| Spaniards | 2.0 /100 | #242 | Tragic 5.9% |
| Indonesians | 2.0 /100 | #243 | Tragic 5.9% |
| Immigrants | Germany | 1.9 /100 | #244 | Tragic 5.9% |
| Immigrants | Micronesia | 1.9 /100 | #245 | Tragic 5.9% |
| Tlingit-Haida | 1.9 /100 | #246 | Tragic 5.9% |
| Immigrants | Honduras | 1.8 /100 | #247 | Tragic 5.9% |
| British | 1.7 /100 | #248 | Tragic 5.9% |
| Immigrants | Ghana | 1.7 /100 | #249 | Tragic 5.9% |
| Poles | 1.5 /100 | #250 | Tragic 5.9% |