Immigrants from Belgium vs Immigrants from Oceania Disability Age 5 to 17
COMPARE
Immigrants from Belgium
Immigrants from Oceania
Disability Age 5 to 17
Disability Age 5 to 17 Comparison
Immigrants from Belgium
Immigrants from Oceania
5.2%
DISABILITY AGE 5 TO 17
99.7/ 100
METRIC RATING
70th/ 347
METRIC RANK
5.4%
DISABILITY AGE 5 TO 17
90.8/ 100
METRIC RATING
138th/ 347
METRIC RANK
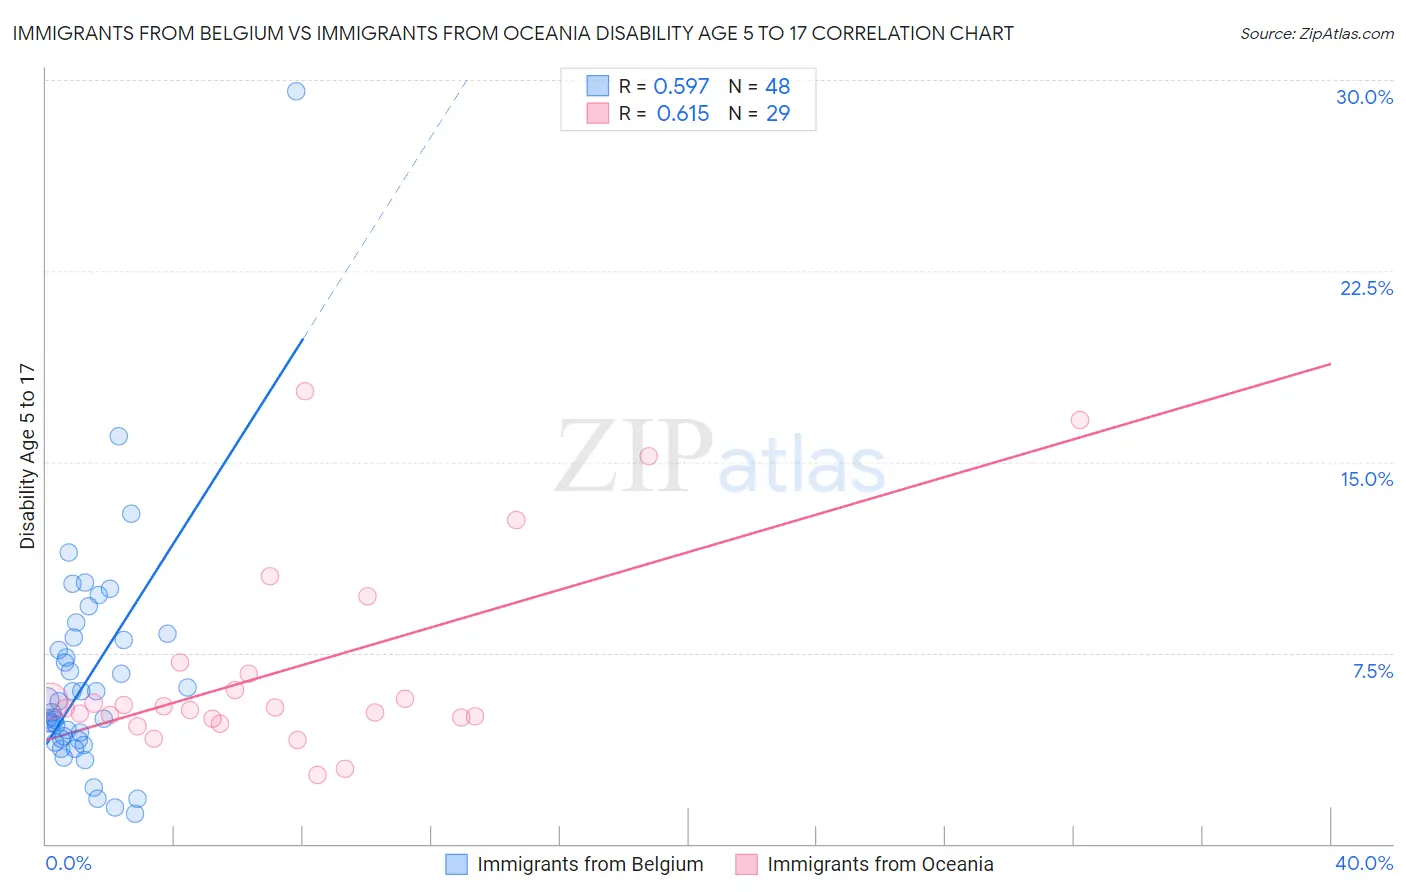
Immigrants from Belgium vs Immigrants from Oceania Disability Age 5 to 17 Correlation Chart
The statistical analysis conducted on geographies consisting of 146,050,104 people shows a substantial positive correlation between the proportion of Immigrants from Belgium and percentage of population with a disability between the ages 5 and 17 in the United States with a correlation coefficient (R) of 0.597 and weighted average of 5.2%. Similarly, the statistical analysis conducted on geographies consisting of 303,486,257 people shows a significant positive correlation between the proportion of Immigrants from Oceania and percentage of population with a disability between the ages 5 and 17 in the United States with a correlation coefficient (R) of 0.615 and weighted average of 5.4%, a difference of 4.7%.
Disability Age 5 to 17 Correlation Summary
| Measurement | Immigrants from Belgium | Immigrants from Oceania |
| Minimum | 1.2% | 2.7% |
| Maximum | 29.6% | 17.7% |
| Range | 28.4% | 15.1% |
| Mean | 6.5% | 6.9% |
| Median | 5.4% | 5.3% |
| Interquartile 25% (IQ1) | 4.1% | 4.9% |
| Interquartile 75% (IQ3) | 8.0% | 6.9% |
| Interquartile Range (IQR) | 3.9% | 2.0% |
| Standard Deviation (Sample) | 4.6% | 3.9% |
| Standard Deviation (Population) | 4.5% | 3.9% |
Similar Demographics by Disability Age 5 to 17
Demographics Similar to Immigrants from Belgium by Disability Age 5 to 17
In terms of disability age 5 to 17, the demographic groups most similar to Immigrants from Belgium are Guyanese (5.2%, a difference of 0.040%), Jordanian (5.2%, a difference of 0.050%), Immigrants from Vietnam (5.2%, a difference of 0.070%), Immigrants from Czechoslovakia (5.2%, a difference of 0.090%), and Immigrants from Syria (5.2%, a difference of 0.15%).
| Demographics | Rating | Rank | Disability Age 5 to 17 |
| Immigrants | Bangladesh | 99.8 /100 | #63 | Exceptional 5.2% |
| Immigrants | South Eastern Asia | 99.8 /100 | #64 | Exceptional 5.2% |
| Immigrants | Greece | 99.8 /100 | #65 | Exceptional 5.2% |
| Palestinians | 99.8 /100 | #66 | Exceptional 5.2% |
| Macedonians | 99.8 /100 | #67 | Exceptional 5.2% |
| Immigrants | Syria | 99.7 /100 | #68 | Exceptional 5.2% |
| Guyanese | 99.7 /100 | #69 | Exceptional 5.2% |
| Immigrants | Belgium | 99.7 /100 | #70 | Exceptional 5.2% |
| Jordanians | 99.7 /100 | #71 | Exceptional 5.2% |
| Immigrants | Vietnam | 99.7 /100 | #72 | Exceptional 5.2% |
| Immigrants | Czechoslovakia | 99.7 /100 | #73 | Exceptional 5.2% |
| Immigrants | Romania | 99.7 /100 | #74 | Exceptional 5.2% |
| Immigrants | Moldova | 99.6 /100 | #75 | Exceptional 5.2% |
| Immigrants | Guyana | 99.6 /100 | #76 | Exceptional 5.2% |
| Immigrants | Kazakhstan | 99.6 /100 | #77 | Exceptional 5.2% |
Demographics Similar to Immigrants from Oceania by Disability Age 5 to 17
In terms of disability age 5 to 17, the demographic groups most similar to Immigrants from Oceania are Navajo (5.4%, a difference of 0.0%), Belizean (5.4%, a difference of 0.0%), Immigrants from Netherlands (5.4%, a difference of 0.050%), Immigrants from Denmark (5.4%, a difference of 0.090%), and Immigrants from Belize (5.4%, a difference of 0.14%).
| Demographics | Rating | Rank | Disability Age 5 to 17 |
| Arabs | 92.9 /100 | #131 | Exceptional 5.4% |
| Immigrants | Colombia | 92.9 /100 | #132 | Exceptional 5.4% |
| Venezuelans | 92.7 /100 | #133 | Exceptional 5.4% |
| Yuman | 92.3 /100 | #134 | Exceptional 5.4% |
| Immigrants | Belize | 91.7 /100 | #135 | Exceptional 5.4% |
| Immigrants | Denmark | 91.4 /100 | #136 | Exceptional 5.4% |
| Navajo | 90.9 /100 | #137 | Exceptional 5.4% |
| Immigrants | Oceania | 90.8 /100 | #138 | Exceptional 5.4% |
| Belizeans | 90.8 /100 | #139 | Exceptional 5.4% |
| Immigrants | Netherlands | 90.5 /100 | #140 | Exceptional 5.4% |
| South American Indians | 89.3 /100 | #141 | Excellent 5.5% |
| Colombians | 88.0 /100 | #142 | Excellent 5.5% |
| Immigrants | Hungary | 87.9 /100 | #143 | Excellent 5.5% |
| Pakistanis | 87.3 /100 | #144 | Excellent 5.5% |
| Immigrants | Guatemala | 86.6 /100 | #145 | Excellent 5.5% |