Immigrants from Belarus vs Immigrants from Nicaragua Ambulatory Disability
COMPARE
Immigrants from Belarus
Immigrants from Nicaragua
Ambulatory Disability
Ambulatory Disability Comparison
Immigrants from Belarus
Immigrants from Nicaragua
6.1%
AMBULATORY DISABILITY
69.2/ 100
METRIC RATING
161st/ 347
METRIC RANK
6.1%
AMBULATORY DISABILITY
43.9/ 100
METRIC RATING
180th/ 347
METRIC RANK
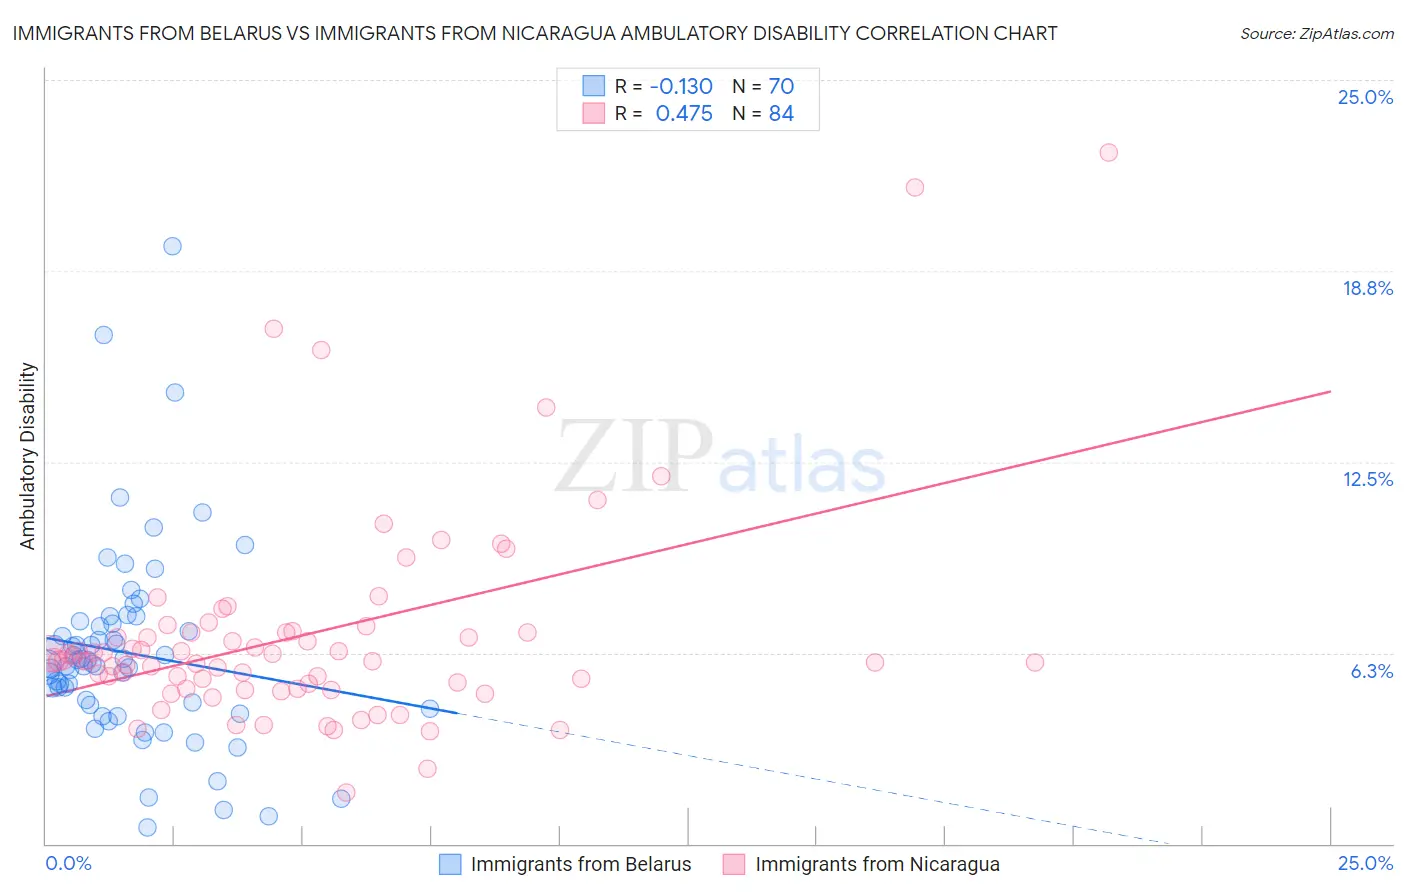
Immigrants from Belarus vs Immigrants from Nicaragua Ambulatory Disability Correlation Chart
The statistical analysis conducted on geographies consisting of 150,188,321 people shows a poor negative correlation between the proportion of Immigrants from Belarus and percentage of population with ambulatory disability in the United States with a correlation coefficient (R) of -0.130 and weighted average of 6.1%. Similarly, the statistical analysis conducted on geographies consisting of 236,322,252 people shows a moderate positive correlation between the proportion of Immigrants from Nicaragua and percentage of population with ambulatory disability in the United States with a correlation coefficient (R) of 0.475 and weighted average of 6.1%, a difference of 1.4%.
Ambulatory Disability Correlation Summary
| Measurement | Immigrants from Belarus | Immigrants from Nicaragua |
| Minimum | 0.54% | 1.7% |
| Maximum | 19.6% | 22.6% |
| Range | 19.0% | 20.9% |
| Mean | 6.2% | 6.8% |
| Median | 5.9% | 6.0% |
| Interquartile 25% (IQ1) | 4.5% | 5.2% |
| Interquartile 75% (IQ3) | 7.2% | 6.9% |
| Interquartile Range (IQR) | 2.7% | 1.7% |
| Standard Deviation (Sample) | 3.2% | 3.5% |
| Standard Deviation (Population) | 3.2% | 3.5% |
Demographics Similar to Immigrants from Belarus and Immigrants from Nicaragua by Ambulatory Disability
In terms of ambulatory disability, the demographic groups most similar to Immigrants from Belarus are Central American (6.0%, a difference of 0.040%), Nigerian (6.1%, a difference of 0.13%), Lebanese (6.1%, a difference of 0.18%), Basque (6.1%, a difference of 0.33%), and Nicaraguan (6.1%, a difference of 0.36%). Similarly, the demographic groups most similar to Immigrants from Nicaragua are Austrian (6.1%, a difference of 0.010%), Scandinavian (6.1%, a difference of 0.030%), Immigrants from England (6.1%, a difference of 0.080%), Immigrants from North America (6.1%, a difference of 0.090%), and Vietnamese (6.1%, a difference of 0.17%).
| Demographics | Rating | Rank | Ambulatory Disability |
| Central Americans | 69.8 /100 | #160 | Good 6.0% |
| Immigrants | Belarus | 69.2 /100 | #161 | Good 6.1% |
| Nigerians | 67.1 /100 | #162 | Good 6.1% |
| Lebanese | 66.2 /100 | #163 | Good 6.1% |
| Basques | 63.7 /100 | #164 | Good 6.1% |
| Nicaraguans | 63.2 /100 | #165 | Good 6.1% |
| Iraqis | 62.8 /100 | #166 | Good 6.1% |
| Immigrants | Oceania | 60.7 /100 | #167 | Good 6.1% |
| Ecuadorians | 60.5 /100 | #168 | Good 6.1% |
| Immigrants | Southern Europe | 58.1 /100 | #169 | Average 6.1% |
| Immigrants | Ecuador | 53.8 /100 | #170 | Average 6.1% |
| Moroccans | 52.6 /100 | #171 | Average 6.1% |
| Immigrants | Burma/Myanmar | 52.2 /100 | #172 | Average 6.1% |
| Croatians | 51.2 /100 | #173 | Average 6.1% |
| Immigrants | Canada | 50.0 /100 | #174 | Average 6.1% |
| Vietnamese | 47.2 /100 | #175 | Average 6.1% |
| Immigrants | North America | 45.6 /100 | #176 | Average 6.1% |
| Immigrants | England | 45.4 /100 | #177 | Average 6.1% |
| Scandinavians | 44.5 /100 | #178 | Average 6.1% |
| Austrians | 44.1 /100 | #179 | Average 6.1% |
| Immigrants | Nicaragua | 43.9 /100 | #180 | Average 6.1% |