Dominican vs Immigrants from Morocco Disability Age 5 to 17
COMPARE
Dominican
Immigrants from Morocco
Disability Age 5 to 17
Disability Age 5 to 17 Comparison
Dominicans
Immigrants from Morocco
6.5%
DISABILITY AGE 5 TO 17
0.0/ 100
METRIC RATING
324th/ 347
METRIC RANK
5.8%
DISABILITY AGE 5 TO 17
8.3/ 100
METRIC RATING
214th/ 347
METRIC RANK
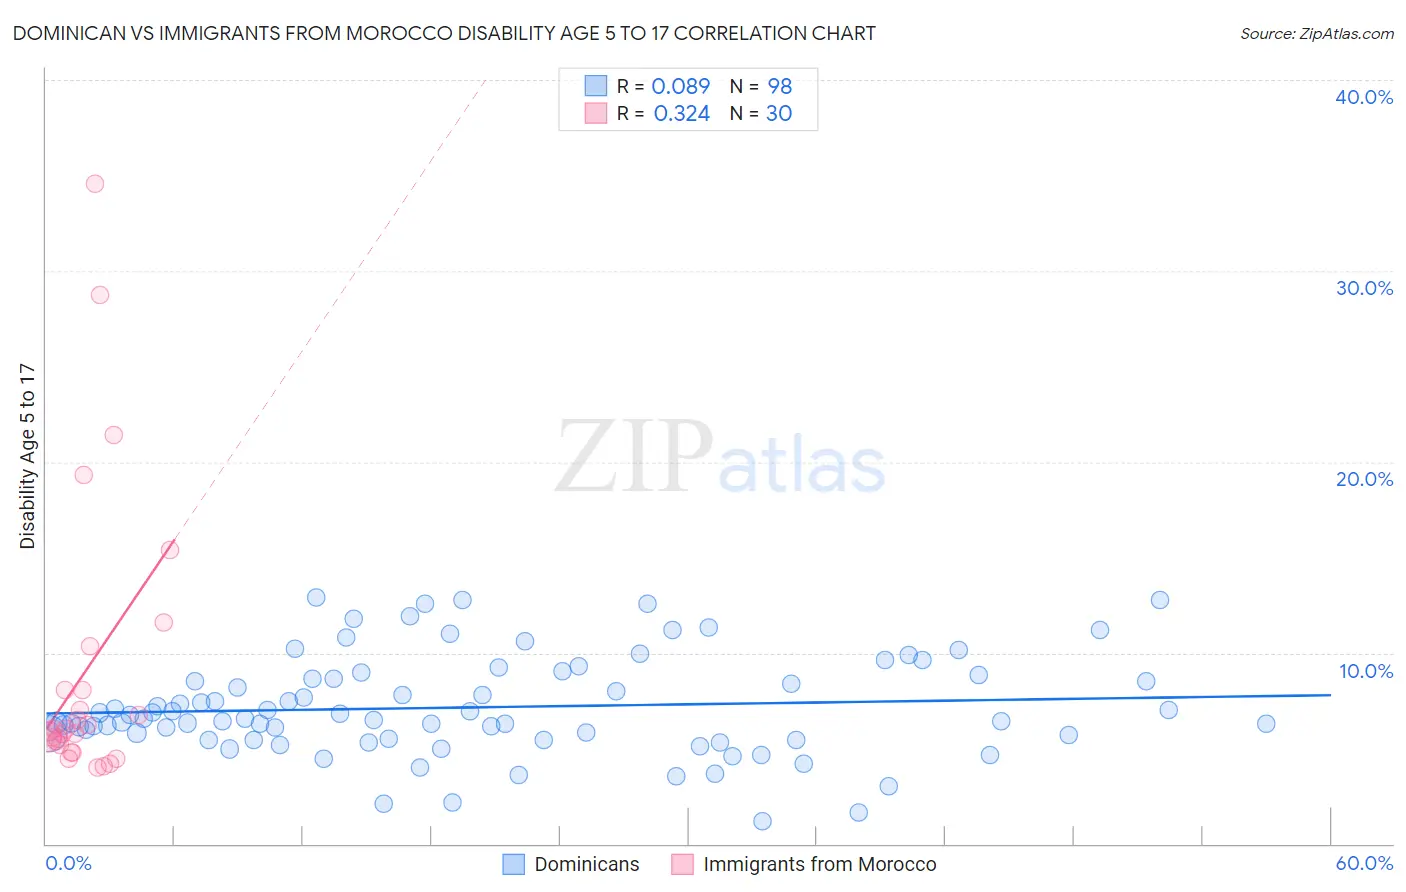
Dominican vs Immigrants from Morocco Disability Age 5 to 17 Correlation Chart
The statistical analysis conducted on geographies consisting of 352,404,408 people shows a slight positive correlation between the proportion of Dominicans and percentage of population with a disability between the ages 5 and 17 in the United States with a correlation coefficient (R) of 0.089 and weighted average of 6.5%. Similarly, the statistical analysis conducted on geographies consisting of 178,475,877 people shows a mild positive correlation between the proportion of Immigrants from Morocco and percentage of population with a disability between the ages 5 and 17 in the United States with a correlation coefficient (R) of 0.324 and weighted average of 5.8%, a difference of 13.2%.
Disability Age 5 to 17 Correlation Summary
| Measurement | Dominican | Immigrants from Morocco |
| Minimum | 1.2% | 4.0% |
| Maximum | 12.9% | 34.6% |
| Range | 11.7% | 30.6% |
| Mean | 7.1% | 9.0% |
| Median | 6.5% | 6.0% |
| Interquartile 25% (IQ1) | 5.5% | 5.2% |
| Interquartile 75% (IQ3) | 8.7% | 8.0% |
| Interquartile Range (IQR) | 3.1% | 2.9% |
| Standard Deviation (Sample) | 2.6% | 7.5% |
| Standard Deviation (Population) | 2.6% | 7.4% |
Similar Demographics by Disability Age 5 to 17
Demographics Similar to Dominicans by Disability Age 5 to 17
In terms of disability age 5 to 17, the demographic groups most similar to Dominicans are American (6.5%, a difference of 0.050%), Osage (6.5%, a difference of 0.080%), Slovak (6.5%, a difference of 0.12%), Tohono O'odham (6.5%, a difference of 0.14%), and Potawatomi (6.5%, a difference of 0.19%).
| Demographics | Rating | Rank | Disability Age 5 to 17 |
| Kiowa | 0.0 /100 | #317 | Tragic 6.4% |
| Comanche | 0.0 /100 | #318 | Tragic 6.4% |
| Delaware | 0.0 /100 | #319 | Tragic 6.5% |
| Africans | 0.0 /100 | #320 | Tragic 6.5% |
| Tohono O'odham | 0.0 /100 | #321 | Tragic 6.5% |
| Slovaks | 0.0 /100 | #322 | Tragic 6.5% |
| Osage | 0.0 /100 | #323 | Tragic 6.5% |
| Dominicans | 0.0 /100 | #324 | Tragic 6.5% |
| Americans | 0.0 /100 | #325 | Tragic 6.5% |
| Potawatomi | 0.0 /100 | #326 | Tragic 6.5% |
| French American Indians | 0.0 /100 | #327 | Tragic 6.6% |
| Pennsylvania Germans | 0.0 /100 | #328 | Tragic 6.6% |
| Blackfeet | 0.0 /100 | #329 | Tragic 6.6% |
| Dutch West Indians | 0.0 /100 | #330 | Tragic 6.7% |
| French Canadians | 0.0 /100 | #331 | Tragic 6.7% |
Demographics Similar to Immigrants from Morocco by Disability Age 5 to 17
In terms of disability age 5 to 17, the demographic groups most similar to Immigrants from Morocco are Immigrants from Cameroon (5.8%, a difference of 0.0%), Swedish (5.8%, a difference of 0.040%), Immigrants from Panama (5.8%, a difference of 0.050%), Yugoslavian (5.8%, a difference of 0.12%), and Nigerian (5.8%, a difference of 0.13%).
| Demographics | Rating | Rank | Disability Age 5 to 17 |
| Moroccans | 10.4 /100 | #207 | Poor 5.7% |
| Kenyans | 10.0 /100 | #208 | Poor 5.8% |
| Immigrants | Uganda | 9.7 /100 | #209 | Tragic 5.8% |
| Immigrants | Haiti | 9.5 /100 | #210 | Tragic 5.8% |
| Yugoslavians | 9.1 /100 | #211 | Tragic 5.8% |
| Immigrants | Panama | 8.7 /100 | #212 | Tragic 5.8% |
| Immigrants | Cameroon | 8.3 /100 | #213 | Tragic 5.8% |
| Immigrants | Morocco | 8.3 /100 | #214 | Tragic 5.8% |
| Swedes | 8.1 /100 | #215 | Tragic 5.8% |
| Nigerians | 7.5 /100 | #216 | Tragic 5.8% |
| Czechs | 7.4 /100 | #217 | Tragic 5.8% |
| Immigrants | Sierra Leone | 7.1 /100 | #218 | Tragic 5.8% |
| Sierra Leoneans | 7.0 /100 | #219 | Tragic 5.8% |
| Belgians | 6.9 /100 | #220 | Tragic 5.8% |
| Lithuanians | 6.7 /100 | #221 | Tragic 5.8% |