Dominican vs Immigrants from Italy Disability Age 5 to 17
COMPARE
Dominican
Immigrants from Italy
Disability Age 5 to 17
Disability Age 5 to 17 Comparison
Dominicans
Immigrants from Italy
6.5%
DISABILITY AGE 5 TO 17
0.0/ 100
METRIC RATING
324th/ 347
METRIC RANK
5.3%
DISABILITY AGE 5 TO 17
98.4/ 100
METRIC RATING
105th/ 347
METRIC RANK
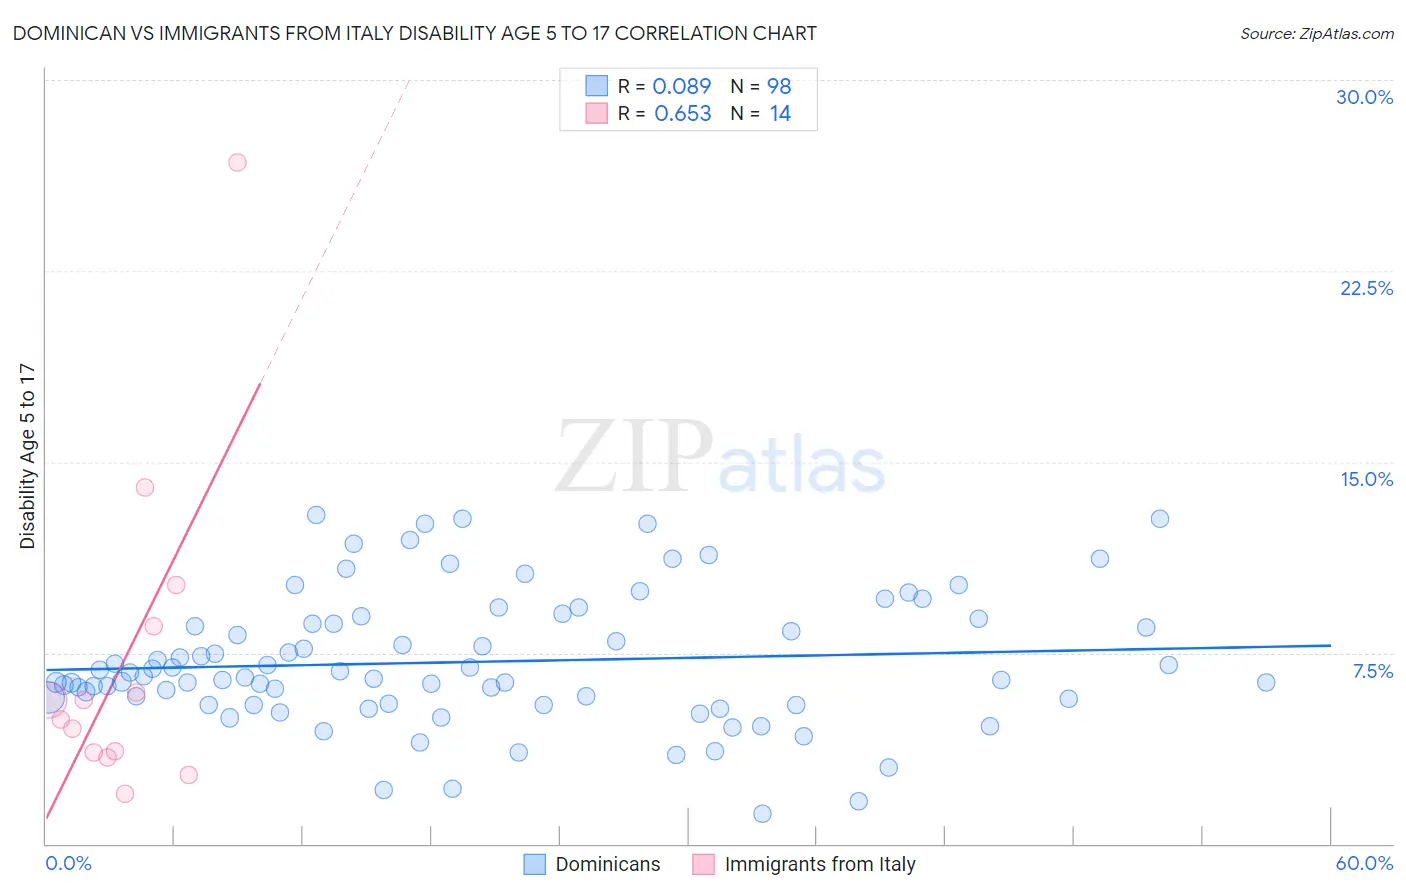
Dominican vs Immigrants from Italy Disability Age 5 to 17 Correlation Chart
The statistical analysis conducted on geographies consisting of 352,404,408 people shows a slight positive correlation between the proportion of Dominicans and percentage of population with a disability between the ages 5 and 17 in the United States with a correlation coefficient (R) of 0.089 and weighted average of 6.5%. Similarly, the statistical analysis conducted on geographies consisting of 321,280,380 people shows a significant positive correlation between the proportion of Immigrants from Italy and percentage of population with a disability between the ages 5 and 17 in the United States with a correlation coefficient (R) of 0.653 and weighted average of 5.3%, a difference of 22.7%.
Disability Age 5 to 17 Correlation Summary
| Measurement | Dominican | Immigrants from Italy |
| Minimum | 1.2% | 2.0% |
| Maximum | 12.9% | 26.8% |
| Range | 11.7% | 24.8% |
| Mean | 7.1% | 7.2% |
| Median | 6.5% | 5.3% |
| Interquartile 25% (IQ1) | 5.5% | 3.6% |
| Interquartile 75% (IQ3) | 8.7% | 8.6% |
| Interquartile Range (IQR) | 3.1% | 5.0% |
| Standard Deviation (Sample) | 2.6% | 6.5% |
| Standard Deviation (Population) | 2.6% | 6.3% |
Similar Demographics by Disability Age 5 to 17
Demographics Similar to Dominicans by Disability Age 5 to 17
In terms of disability age 5 to 17, the demographic groups most similar to Dominicans are American (6.5%, a difference of 0.050%), Osage (6.5%, a difference of 0.080%), Slovak (6.5%, a difference of 0.12%), Tohono O'odham (6.5%, a difference of 0.14%), and Potawatomi (6.5%, a difference of 0.19%).
| Demographics | Rating | Rank | Disability Age 5 to 17 |
| Kiowa | 0.0 /100 | #317 | Tragic 6.4% |
| Comanche | 0.0 /100 | #318 | Tragic 6.4% |
| Delaware | 0.0 /100 | #319 | Tragic 6.5% |
| Africans | 0.0 /100 | #320 | Tragic 6.5% |
| Tohono O'odham | 0.0 /100 | #321 | Tragic 6.5% |
| Slovaks | 0.0 /100 | #322 | Tragic 6.5% |
| Osage | 0.0 /100 | #323 | Tragic 6.5% |
| Dominicans | 0.0 /100 | #324 | Tragic 6.5% |
| Americans | 0.0 /100 | #325 | Tragic 6.5% |
| Potawatomi | 0.0 /100 | #326 | Tragic 6.5% |
| French American Indians | 0.0 /100 | #327 | Tragic 6.6% |
| Pennsylvania Germans | 0.0 /100 | #328 | Tragic 6.6% |
| Blackfeet | 0.0 /100 | #329 | Tragic 6.6% |
| Dutch West Indians | 0.0 /100 | #330 | Tragic 6.7% |
| French Canadians | 0.0 /100 | #331 | Tragic 6.7% |
Demographics Similar to Immigrants from Italy by Disability Age 5 to 17
In terms of disability age 5 to 17, the demographic groups most similar to Immigrants from Italy are Peruvian (5.3%, a difference of 0.090%), Immigrants from Yemen (5.3%, a difference of 0.13%), Russian (5.3%, a difference of 0.16%), Salvadoran (5.3%, a difference of 0.17%), and Nicaraguan (5.3%, a difference of 0.19%).
| Demographics | Rating | Rank | Disability Age 5 to 17 |
| Immigrants | Austria | 98.9 /100 | #98 | Exceptional 5.3% |
| Cambodians | 98.8 /100 | #99 | Exceptional 5.3% |
| Nepalese | 98.7 /100 | #100 | Exceptional 5.3% |
| Menominee | 98.7 /100 | #101 | Exceptional 5.3% |
| Nicaraguans | 98.6 /100 | #102 | Exceptional 5.3% |
| Salvadorans | 98.6 /100 | #103 | Exceptional 5.3% |
| Peruvians | 98.5 /100 | #104 | Exceptional 5.3% |
| Immigrants | Italy | 98.4 /100 | #105 | Exceptional 5.3% |
| Immigrants | Yemen | 98.2 /100 | #106 | Exceptional 5.3% |
| Russians | 98.2 /100 | #107 | Exceptional 5.3% |
| Immigrants | South Africa | 98.1 /100 | #108 | Exceptional 5.3% |
| Immigrants | Northern Africa | 98.1 /100 | #109 | Exceptional 5.3% |
| Immigrants | Eritrea | 98.0 /100 | #110 | Exceptional 5.3% |
| Ethiopians | 97.9 /100 | #111 | Exceptional 5.3% |
| Immigrants | Latvia | 97.9 /100 | #112 | Exceptional 5.3% |