Crow vs Cree Male Disability
COMPARE
Crow
Cree
Male Disability
Male Disability Comparison
Crow
Cree
13.1%
MALE DISABILITY
0.0/ 100
METRIC RATING
302nd/ 347
METRIC RANK
13.7%
MALE DISABILITY
0.0/ 100
METRIC RATING
318th/ 347
METRIC RANK
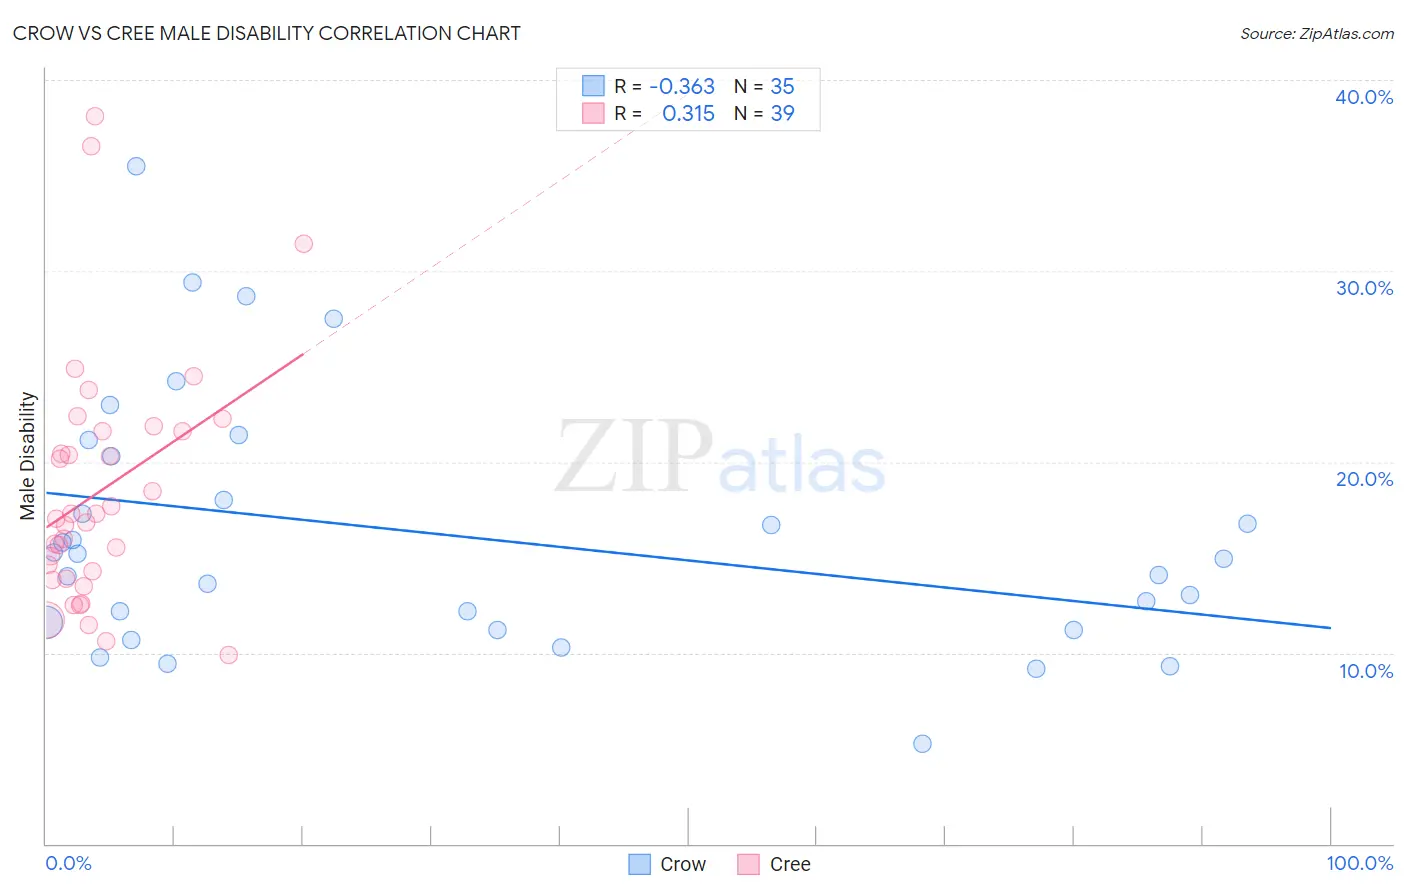
Crow vs Cree Male Disability Correlation Chart
The statistical analysis conducted on geographies consisting of 59,204,441 people shows a mild negative correlation between the proportion of Crow and percentage of males with a disability in the United States with a correlation coefficient (R) of -0.363 and weighted average of 13.1%. Similarly, the statistical analysis conducted on geographies consisting of 76,208,606 people shows a mild positive correlation between the proportion of Cree and percentage of males with a disability in the United States with a correlation coefficient (R) of 0.315 and weighted average of 13.7%, a difference of 4.5%.
Male Disability Correlation Summary
| Measurement | Crow | Cree |
| Minimum | 5.2% | 9.9% |
| Maximum | 35.5% | 38.1% |
| Range | 30.2% | 28.2% |
| Mean | 16.2% | 18.5% |
| Median | 14.9% | 17.0% |
| Interquartile 25% (IQ1) | 11.2% | 13.9% |
| Interquartile 75% (IQ3) | 20.3% | 21.6% |
| Interquartile Range (IQR) | 9.1% | 7.7% |
| Standard Deviation (Sample) | 6.7% | 6.4% |
| Standard Deviation (Population) | 6.6% | 6.3% |
Demographics Similar to Crow and Cree by Male Disability
In terms of male disability, the demographic groups most similar to Crow are Scotch-Irish (13.2%, a difference of 0.54%), French (13.0%, a difference of 0.58%), Cheyenne (13.0%, a difference of 0.63%), Black/African American (13.2%, a difference of 0.87%), and French Canadian (13.3%, a difference of 1.3%). Similarly, the demographic groups most similar to Cree are Paiute (13.7%, a difference of 0.21%), American (13.8%, a difference of 0.41%), Tlingit-Haida (13.8%, a difference of 0.90%), Alaska Native (13.6%, a difference of 1.0%), and Iroquois (13.6%, a difference of 1.1%).
| Demographics | Rating | Rank | Male Disability |
| Cheyenne | 0.0 /100 | #300 | Tragic 13.0% |
| French | 0.0 /100 | #301 | Tragic 13.0% |
| Crow | 0.0 /100 | #302 | Tragic 13.1% |
| Scotch-Irish | 0.0 /100 | #303 | Tragic 13.2% |
| Blacks/African Americans | 0.0 /100 | #304 | Tragic 13.2% |
| French Canadians | 0.0 /100 | #305 | Tragic 13.3% |
| Spanish Americans | 0.0 /100 | #306 | Tragic 13.3% |
| Arapaho | 0.0 /100 | #307 | Tragic 13.3% |
| French American Indians | 0.0 /100 | #308 | Tragic 13.4% |
| Blackfeet | 0.0 /100 | #309 | Tragic 13.4% |
| Immigrants | Azores | 0.0 /100 | #310 | Tragic 13.4% |
| Delaware | 0.0 /100 | #311 | Tragic 13.5% |
| Yakama | 0.0 /100 | #312 | Tragic 13.5% |
| Puget Sound Salish | 0.0 /100 | #313 | Tragic 13.5% |
| Aleuts | 0.0 /100 | #314 | Tragic 13.5% |
| Iroquois | 0.0 /100 | #315 | Tragic 13.6% |
| Alaska Natives | 0.0 /100 | #316 | Tragic 13.6% |
| Paiute | 0.0 /100 | #317 | Tragic 13.7% |
| Cree | 0.0 /100 | #318 | Tragic 13.7% |
| Americans | 0.0 /100 | #319 | Tragic 13.8% |
| Tlingit-Haida | 0.0 /100 | #320 | Tragic 13.8% |