Crow vs Menominee Male Disability
COMPARE
Crow
Menominee
Male Disability
Male Disability Comparison
Crow
Menominee
13.1%
MALE DISABILITY
0.0/ 100
METRIC RATING
302nd/ 347
METRIC RANK
15.0%
MALE DISABILITY
0.0/ 100
METRIC RATING
337th/ 347
METRIC RANK
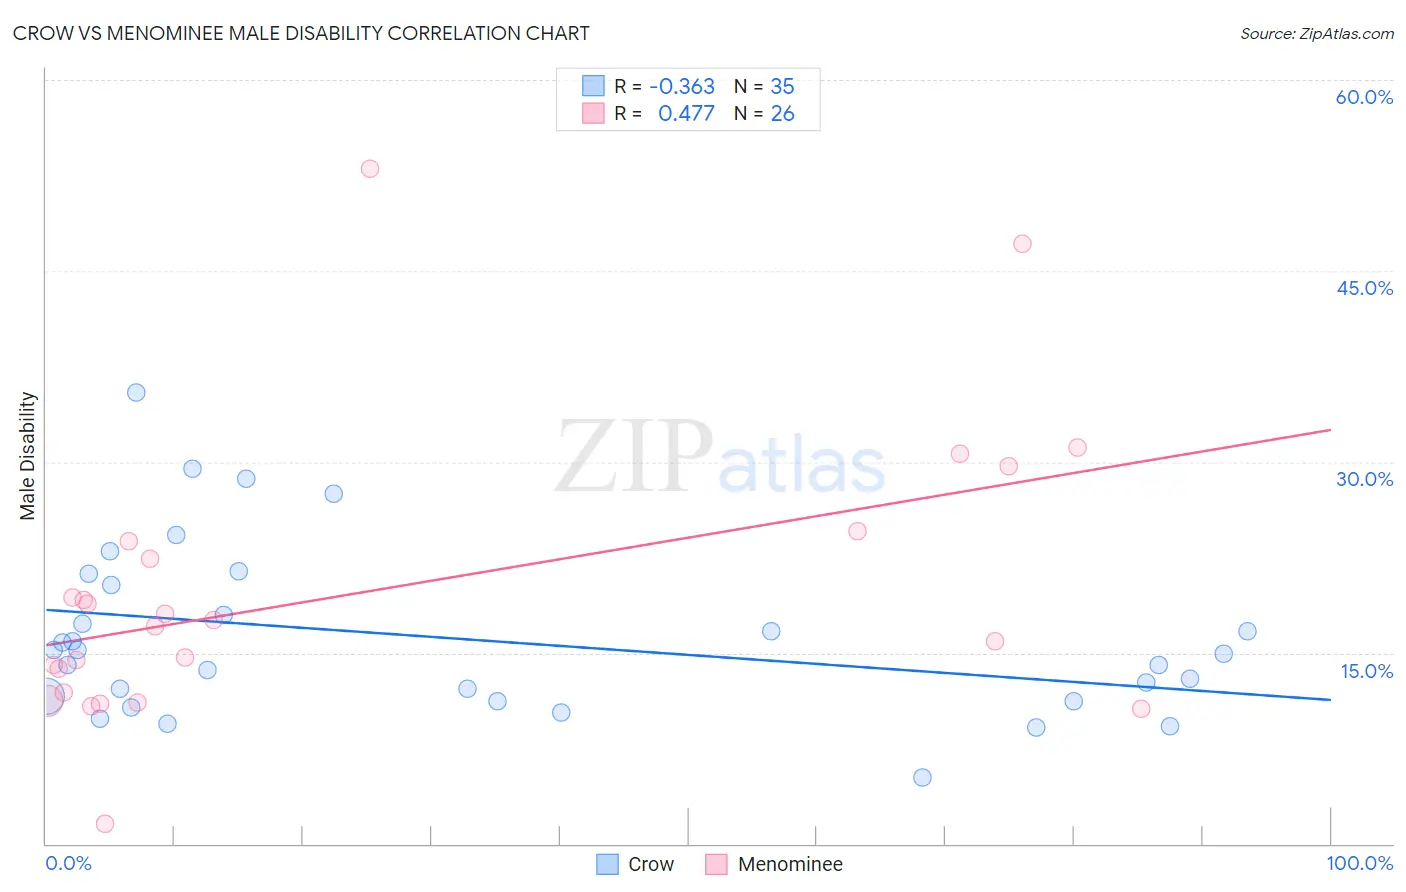
Crow vs Menominee Male Disability Correlation Chart
The statistical analysis conducted on geographies consisting of 59,204,441 people shows a mild negative correlation between the proportion of Crow and percentage of males with a disability in the United States with a correlation coefficient (R) of -0.363 and weighted average of 13.1%. Similarly, the statistical analysis conducted on geographies consisting of 45,777,737 people shows a moderate positive correlation between the proportion of Menominee and percentage of males with a disability in the United States with a correlation coefficient (R) of 0.477 and weighted average of 15.0%, a difference of 14.2%.
Male Disability Correlation Summary
| Measurement | Crow | Menominee |
| Minimum | 5.2% | 1.6% |
| Maximum | 35.5% | 53.0% |
| Range | 30.2% | 51.5% |
| Mean | 16.2% | 19.7% |
| Median | 14.9% | 17.4% |
| Interquartile 25% (IQ1) | 11.2% | 11.9% |
| Interquartile 75% (IQ3) | 20.3% | 23.8% |
| Interquartile Range (IQR) | 9.1% | 11.9% |
| Standard Deviation (Sample) | 6.7% | 11.3% |
| Standard Deviation (Population) | 6.6% | 11.1% |
Similar Demographics by Male Disability
Demographics Similar to Crow by Male Disability
In terms of male disability, the demographic groups most similar to Crow are Scotch-Irish (13.2%, a difference of 0.54%), French (13.0%, a difference of 0.58%), Cheyenne (13.0%, a difference of 0.63%), Celtic (13.0%, a difference of 0.72%), and Black/African American (13.2%, a difference of 0.87%).
| Demographics | Rating | Rank | Male Disability |
| Immigrants | Micronesia | 0.0 /100 | #295 | Tragic 12.9% |
| Immigrants | Nonimmigrants | 0.0 /100 | #296 | Tragic 12.9% |
| Inupiat | 0.0 /100 | #297 | Tragic 13.0% |
| Pennsylvania Germans | 0.0 /100 | #298 | Tragic 13.0% |
| Celtics | 0.0 /100 | #299 | Tragic 13.0% |
| Cheyenne | 0.0 /100 | #300 | Tragic 13.0% |
| French | 0.0 /100 | #301 | Tragic 13.0% |
| Crow | 0.0 /100 | #302 | Tragic 13.1% |
| Scotch-Irish | 0.0 /100 | #303 | Tragic 13.2% |
| Blacks/African Americans | 0.0 /100 | #304 | Tragic 13.2% |
| French Canadians | 0.0 /100 | #305 | Tragic 13.3% |
| Spanish Americans | 0.0 /100 | #306 | Tragic 13.3% |
| Arapaho | 0.0 /100 | #307 | Tragic 13.3% |
| French American Indians | 0.0 /100 | #308 | Tragic 13.4% |
| Blackfeet | 0.0 /100 | #309 | Tragic 13.4% |
Demographics Similar to Menominee by Male Disability
In terms of male disability, the demographic groups most similar to Menominee are Pueblo (15.0%, a difference of 0.11%), Alaskan Athabascan (14.9%, a difference of 0.51%), Chickasaw (15.1%, a difference of 0.91%), Dutch West Indian (14.8%, a difference of 0.97%), and Cherokee (14.8%, a difference of 1.0%).
| Demographics | Rating | Rank | Male Disability |
| Navajo | 0.0 /100 | #330 | Tragic 14.4% |
| Tohono O'odham | 0.0 /100 | #331 | Tragic 14.6% |
| Seminole | 0.0 /100 | #332 | Tragic 14.7% |
| Yuman | 0.0 /100 | #333 | Tragic 14.7% |
| Cherokee | 0.0 /100 | #334 | Tragic 14.8% |
| Dutch West Indians | 0.0 /100 | #335 | Tragic 14.8% |
| Alaskan Athabascans | 0.0 /100 | #336 | Tragic 14.9% |
| Menominee | 0.0 /100 | #337 | Tragic 15.0% |
| Pueblo | 0.0 /100 | #338 | Tragic 15.0% |
| Chickasaw | 0.0 /100 | #339 | Tragic 15.1% |
| Lumbee | 0.0 /100 | #340 | Tragic 15.2% |
| Choctaw | 0.0 /100 | #341 | Tragic 15.4% |
| Kiowa | 0.0 /100 | #342 | Tragic 15.4% |
| Creek | 0.0 /100 | #343 | Tragic 15.5% |
| Puerto Ricans | 0.0 /100 | #344 | Tragic 15.6% |