Crow vs Trinidadian and Tobagonian Master's Degree
COMPARE
Crow
Trinidadian and Tobagonian
Master's Degree
Master's Degree Comparison
Crow
Trinidadians and Tobagonians
10.6%
MASTER'S DEGREE
0.0/ 100
METRIC RATING
323rd/ 347
METRIC RANK
14.4%
MASTER'S DEGREE
23.5/ 100
METRIC RATING
205th/ 347
METRIC RANK
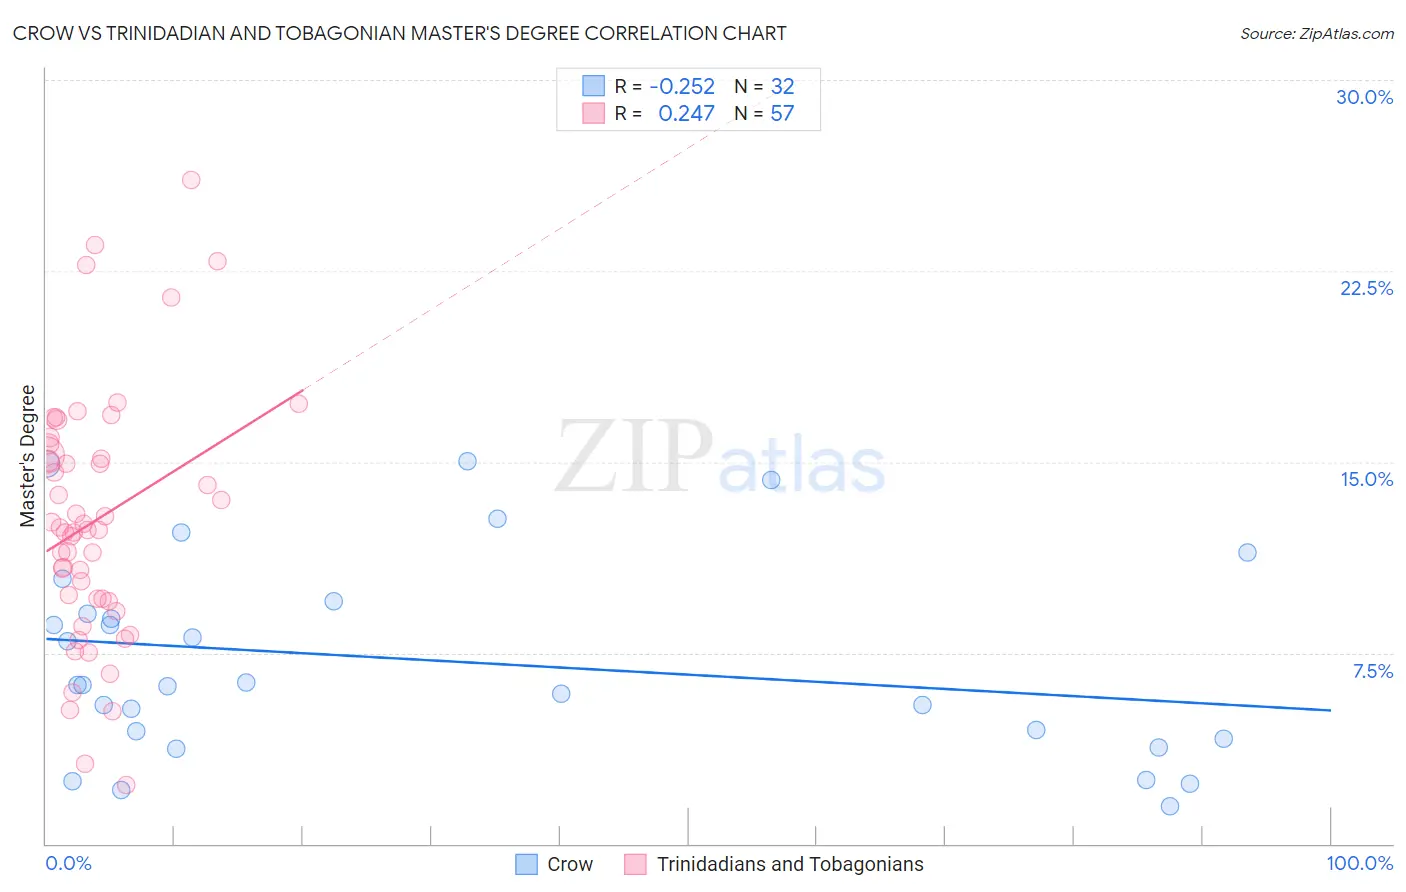
Crow vs Trinidadian and Tobagonian Master's Degree Correlation Chart
The statistical analysis conducted on geographies consisting of 59,200,277 people shows a weak negative correlation between the proportion of Crow and percentage of population with at least master's degree education in the United States with a correlation coefficient (R) of -0.252 and weighted average of 10.6%. Similarly, the statistical analysis conducted on geographies consisting of 219,795,372 people shows a weak positive correlation between the proportion of Trinidadians and Tobagonians and percentage of population with at least master's degree education in the United States with a correlation coefficient (R) of 0.247 and weighted average of 14.4%, a difference of 35.0%.
Master's Degree Correlation Summary
| Measurement | Crow | Trinidadian and Tobagonian |
| Minimum | 1.4% | 2.3% |
| Maximum | 15.0% | 26.1% |
| Range | 13.6% | 23.8% |
| Mean | 7.2% | 12.7% |
| Median | 6.2% | 12.3% |
| Interquartile 25% (IQ1) | 4.3% | 9.6% |
| Interquartile 75% (IQ3) | 9.3% | 15.5% |
| Interquartile Range (IQR) | 5.0% | 5.9% |
| Standard Deviation (Sample) | 3.9% | 4.9% |
| Standard Deviation (Population) | 3.8% | 4.9% |
Similar Demographics by Master's Degree
Demographics Similar to Crow by Master's Degree
In terms of master's degree, the demographic groups most similar to Crow are Dutch West Indian (10.6%, a difference of 0.040%), Sioux (10.7%, a difference of 0.39%), Pennsylvania German (10.7%, a difference of 1.0%), Inupiat (10.5%, a difference of 1.1%), and Creek (10.5%, a difference of 1.1%).
| Demographics | Rating | Rank | Master's Degree |
| Hispanics or Latinos | 0.0 /100 | #316 | Tragic 10.9% |
| Hopi | 0.0 /100 | #317 | Tragic 10.9% |
| Immigrants | Cuba | 0.0 /100 | #318 | Tragic 10.9% |
| Kiowa | 0.0 /100 | #319 | Tragic 10.8% |
| Immigrants | Micronesia | 0.0 /100 | #320 | Tragic 10.8% |
| Pennsylvania Germans | 0.0 /100 | #321 | Tragic 10.7% |
| Sioux | 0.0 /100 | #322 | Tragic 10.7% |
| Crow | 0.0 /100 | #323 | Tragic 10.6% |
| Dutch West Indians | 0.0 /100 | #324 | Tragic 10.6% |
| Inupiat | 0.0 /100 | #325 | Tragic 10.5% |
| Creek | 0.0 /100 | #326 | Tragic 10.5% |
| Paiute | 0.0 /100 | #327 | Tragic 10.5% |
| Bangladeshis | 0.0 /100 | #328 | Tragic 10.5% |
| Nepalese | 0.0 /100 | #329 | Tragic 10.5% |
| Fijians | 0.0 /100 | #330 | Tragic 10.3% |
Demographics Similar to Trinidadians and Tobagonians by Master's Degree
In terms of master's degree, the demographic groups most similar to Trinidadians and Tobagonians are French (14.4%, a difference of 0.030%), Scandinavian (14.4%, a difference of 0.040%), Yugoslavian (14.4%, a difference of 0.15%), Immigrants from Western Africa (14.4%, a difference of 0.26%), and Scotch-Irish (14.4%, a difference of 0.27%).
| Demographics | Rating | Rank | Master's Degree |
| West Indians | 27.4 /100 | #198 | Fair 14.5% |
| Immigrants | Armenia | 27.2 /100 | #199 | Fair 14.5% |
| Panamanians | 25.1 /100 | #200 | Fair 14.4% |
| Scotch-Irish | 25.0 /100 | #201 | Fair 14.4% |
| Immigrants | Western Africa | 24.9 /100 | #202 | Fair 14.4% |
| Yugoslavians | 24.3 /100 | #203 | Fair 14.4% |
| French | 23.7 /100 | #204 | Fair 14.4% |
| Trinidadians and Tobagonians | 23.5 /100 | #205 | Fair 14.4% |
| Scandinavians | 23.3 /100 | #206 | Fair 14.4% |
| Immigrants | Bosnia and Herzegovina | 22.0 /100 | #207 | Fair 14.3% |
| Immigrants | Barbados | 20.5 /100 | #208 | Fair 14.3% |
| Immigrants | Panama | 20.0 /100 | #209 | Fair 14.3% |
| Sub-Saharan Africans | 19.4 /100 | #210 | Poor 14.2% |
| Somalis | 18.0 /100 | #211 | Poor 14.2% |
| Spanish | 17.8 /100 | #212 | Poor 14.2% |