Crow vs Immigrants from Uganda Male Disability
COMPARE
Crow
Immigrants from Uganda
Male Disability
Male Disability Comparison
Crow
Immigrants from Uganda
13.1%
MALE DISABILITY
0.0/ 100
METRIC RATING
302nd/ 347
METRIC RANK
10.8%
MALE DISABILITY
94.0/ 100
METRIC RATING
109th/ 347
METRIC RANK
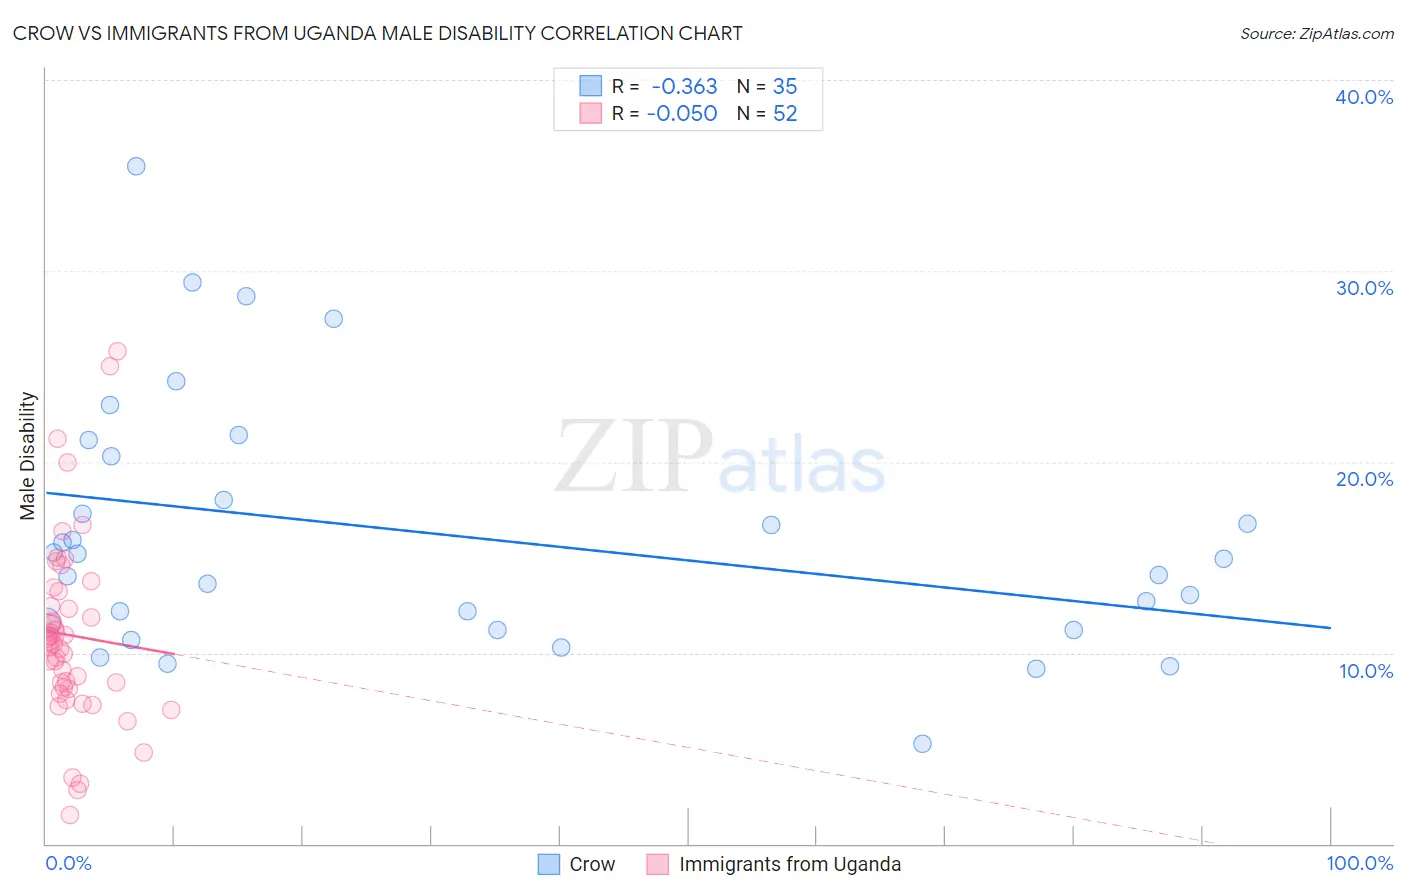
Crow vs Immigrants from Uganda Male Disability Correlation Chart
The statistical analysis conducted on geographies consisting of 59,204,441 people shows a mild negative correlation between the proportion of Crow and percentage of males with a disability in the United States with a correlation coefficient (R) of -0.363 and weighted average of 13.1%. Similarly, the statistical analysis conducted on geographies consisting of 125,978,860 people shows a slight negative correlation between the proportion of Immigrants from Uganda and percentage of males with a disability in the United States with a correlation coefficient (R) of -0.050 and weighted average of 10.8%, a difference of 21.6%.
Male Disability Correlation Summary
| Measurement | Crow | Immigrants from Uganda |
| Minimum | 5.2% | 1.5% |
| Maximum | 35.5% | 25.8% |
| Range | 30.2% | 24.3% |
| Mean | 16.2% | 10.9% |
| Median | 14.9% | 10.5% |
| Interquartile 25% (IQ1) | 11.2% | 8.2% |
| Interquartile 75% (IQ3) | 20.3% | 12.8% |
| Interquartile Range (IQR) | 9.1% | 4.7% |
| Standard Deviation (Sample) | 6.7% | 4.9% |
| Standard Deviation (Population) | 6.6% | 4.8% |
Similar Demographics by Male Disability
Demographics Similar to Crow by Male Disability
In terms of male disability, the demographic groups most similar to Crow are Scotch-Irish (13.2%, a difference of 0.54%), French (13.0%, a difference of 0.58%), Cheyenne (13.0%, a difference of 0.63%), Celtic (13.0%, a difference of 0.72%), and Black/African American (13.2%, a difference of 0.87%).
| Demographics | Rating | Rank | Male Disability |
| Immigrants | Micronesia | 0.0 /100 | #295 | Tragic 12.9% |
| Immigrants | Nonimmigrants | 0.0 /100 | #296 | Tragic 12.9% |
| Inupiat | 0.0 /100 | #297 | Tragic 13.0% |
| Pennsylvania Germans | 0.0 /100 | #298 | Tragic 13.0% |
| Celtics | 0.0 /100 | #299 | Tragic 13.0% |
| Cheyenne | 0.0 /100 | #300 | Tragic 13.0% |
| French | 0.0 /100 | #301 | Tragic 13.0% |
| Crow | 0.0 /100 | #302 | Tragic 13.1% |
| Scotch-Irish | 0.0 /100 | #303 | Tragic 13.2% |
| Blacks/African Americans | 0.0 /100 | #304 | Tragic 13.2% |
| French Canadians | 0.0 /100 | #305 | Tragic 13.3% |
| Spanish Americans | 0.0 /100 | #306 | Tragic 13.3% |
| Arapaho | 0.0 /100 | #307 | Tragic 13.3% |
| French American Indians | 0.0 /100 | #308 | Tragic 13.4% |
| Blackfeet | 0.0 /100 | #309 | Tragic 13.4% |
Demographics Similar to Immigrants from Uganda by Male Disability
In terms of male disability, the demographic groups most similar to Immigrants from Uganda are Immigrants (10.8%, a difference of 0.030%), Immigrants from Belgium (10.8%, a difference of 0.050%), Immigrants from Uruguay (10.8%, a difference of 0.060%), Immigrants from Eastern Africa (10.8%, a difference of 0.070%), and Ghanaian (10.8%, a difference of 0.16%).
| Demographics | Rating | Rank | Male Disability |
| Immigrants | Eastern Europe | 95.3 /100 | #102 | Exceptional 10.7% |
| Uruguayans | 95.3 /100 | #103 | Exceptional 10.7% |
| Immigrants | Nigeria | 95.1 /100 | #104 | Exceptional 10.8% |
| Immigrants | Brazil | 95.0 /100 | #105 | Exceptional 10.8% |
| Immigrants | Syria | 94.9 /100 | #106 | Exceptional 10.8% |
| Immigrants | Eastern Africa | 94.3 /100 | #107 | Exceptional 10.8% |
| Immigrants | Belgium | 94.2 /100 | #108 | Exceptional 10.8% |
| Immigrants | Uganda | 94.0 /100 | #109 | Exceptional 10.8% |
| Immigrants | Immigrants | 93.9 /100 | #110 | Exceptional 10.8% |
| Immigrants | Uruguay | 93.8 /100 | #111 | Exceptional 10.8% |
| Ghanaians | 93.4 /100 | #112 | Exceptional 10.8% |
| Immigrants | Zimbabwe | 93.0 /100 | #113 | Exceptional 10.8% |
| Central Americans | 92.7 /100 | #114 | Exceptional 10.8% |
| Immigrants | Barbados | 92.2 /100 | #115 | Exceptional 10.8% |
| Immigrants | South Africa | 91.8 /100 | #116 | Exceptional 10.8% |