Carpatho Rusyn vs Nonimmigrants Self-Care Disability
COMPARE
Carpatho Rusyn
Nonimmigrants
Self-Care Disability
Self-Care Disability Comparison
Carpatho Rusyns
Nonimmigrants
2.4%
SELF-CARE DISABILITY
94.4/ 100
METRIC RATING
105th/ 347
METRIC RANK
2.6%
SELF-CARE DISABILITY
0.3/ 100
METRIC RATING
258th/ 347
METRIC RANK
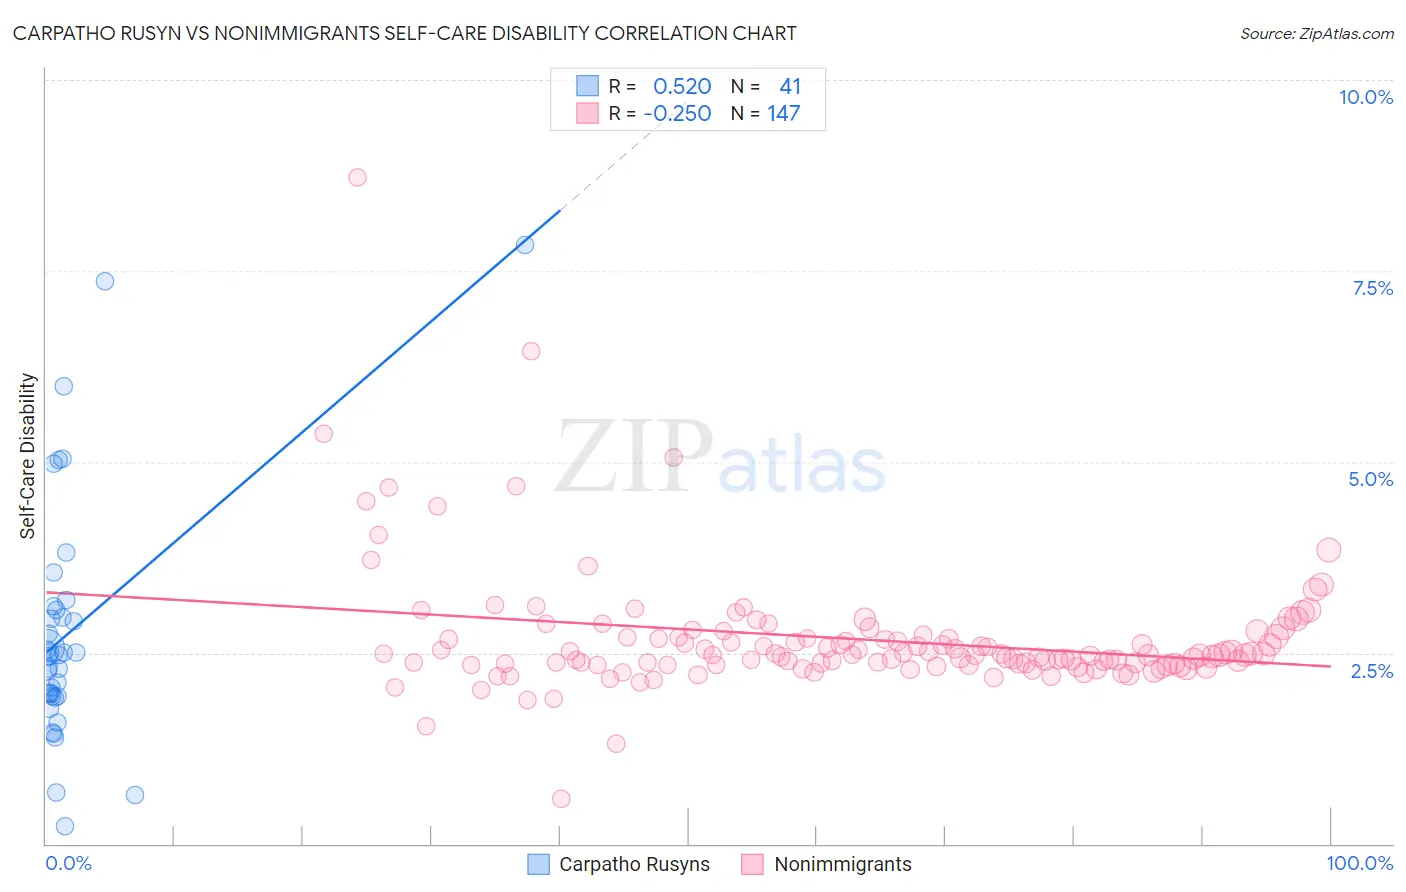
Carpatho Rusyn vs Nonimmigrants Self-Care Disability Correlation Chart
The statistical analysis conducted on geographies consisting of 58,870,733 people shows a substantial positive correlation between the proportion of Carpatho Rusyns and percentage of population with self-care disability in the United States with a correlation coefficient (R) of 0.520 and weighted average of 2.4%. Similarly, the statistical analysis conducted on geographies consisting of 581,524,838 people shows a weak negative correlation between the proportion of Nonimmigrants and percentage of population with self-care disability in the United States with a correlation coefficient (R) of -0.250 and weighted average of 2.6%, a difference of 10.8%.
Self-Care Disability Correlation Summary
| Measurement | Carpatho Rusyn | Nonimmigrants |
| Minimum | 0.22% | 0.58% |
| Maximum | 7.8% | 8.7% |
| Range | 7.6% | 8.1% |
| Mean | 2.8% | 2.7% |
| Median | 2.5% | 2.5% |
| Interquartile 25% (IQ1) | 1.9% | 2.3% |
| Interquartile 75% (IQ3) | 3.1% | 2.7% |
| Interquartile Range (IQR) | 1.2% | 0.36% |
| Standard Deviation (Sample) | 1.6% | 0.84% |
| Standard Deviation (Population) | 1.6% | 0.84% |
Similar Demographics by Self-Care Disability
Demographics Similar to Carpatho Rusyns by Self-Care Disability
In terms of self-care disability, the demographic groups most similar to Carpatho Rusyns are Immigrants from Indonesia (2.4%, a difference of 0.010%), British (2.4%, a difference of 0.020%), Bhutanese (2.4%, a difference of 0.030%), Greek (2.4%, a difference of 0.050%), and Slovene (2.4%, a difference of 0.060%).
| Demographics | Rating | Rank | Self-Care Disability |
| Immigrants | Poland | 96.4 /100 | #98 | Exceptional 2.4% |
| Immigrants | Israel | 96.1 /100 | #99 | Exceptional 2.4% |
| Europeans | 95.8 /100 | #100 | Exceptional 2.4% |
| Immigrants | Scotland | 95.7 /100 | #101 | Exceptional 2.4% |
| Croatians | 95.0 /100 | #102 | Exceptional 2.4% |
| Alsatians | 94.9 /100 | #103 | Exceptional 2.4% |
| Bhutanese | 94.5 /100 | #104 | Exceptional 2.4% |
| Carpatho Rusyns | 94.4 /100 | #105 | Exceptional 2.4% |
| Immigrants | Indonesia | 94.3 /100 | #106 | Exceptional 2.4% |
| British | 94.3 /100 | #107 | Exceptional 2.4% |
| Greeks | 94.1 /100 | #108 | Exceptional 2.4% |
| Slovenes | 94.1 /100 | #109 | Exceptional 2.4% |
| Immigrants | Africa | 93.7 /100 | #110 | Exceptional 2.4% |
| Serbians | 93.6 /100 | #111 | Exceptional 2.4% |
| Scandinavians | 93.5 /100 | #112 | Exceptional 2.4% |
Demographics Similar to Nonimmigrants by Self-Care Disability
In terms of self-care disability, the demographic groups most similar to Nonimmigrants are Potawatomi (2.6%, a difference of 0.070%), Immigrants from Belarus (2.6%, a difference of 0.070%), Chippewa (2.6%, a difference of 0.11%), Arapaho (2.6%, a difference of 0.13%), and Immigrants from Central America (2.6%, a difference of 0.27%).
| Demographics | Rating | Rank | Self-Care Disability |
| Immigrants | Liberia | 0.4 /100 | #251 | Tragic 2.6% |
| Immigrants | Bangladesh | 0.4 /100 | #252 | Tragic 2.6% |
| Immigrants | Haiti | 0.3 /100 | #253 | Tragic 2.6% |
| Haitians | 0.3 /100 | #254 | Tragic 2.6% |
| Tsimshian | 0.3 /100 | #255 | Tragic 2.6% |
| Immigrants | Central America | 0.3 /100 | #256 | Tragic 2.6% |
| Potawatomi | 0.3 /100 | #257 | Tragic 2.6% |
| Immigrants | Nonimmigrants | 0.3 /100 | #258 | Tragic 2.6% |
| Immigrants | Belarus | 0.2 /100 | #259 | Tragic 2.6% |
| Chippewa | 0.2 /100 | #260 | Tragic 2.6% |
| Arapaho | 0.2 /100 | #261 | Tragic 2.6% |
| Shoshone | 0.2 /100 | #262 | Tragic 2.7% |
| Immigrants | Latin America | 0.2 /100 | #263 | Tragic 2.7% |
| Immigrants | Iran | 0.2 /100 | #264 | Tragic 2.7% |
| Immigrants | Nicaragua | 0.2 /100 | #265 | Tragic 2.7% |