Sierra Leonean vs Nonimmigrants Self-Care Disability
COMPARE
Sierra Leonean
Nonimmigrants
Self-Care Disability
Self-Care Disability Comparison
Sierra Leoneans
Nonimmigrants
2.4%
SELF-CARE DISABILITY
98.0/ 100
METRIC RATING
87th/ 347
METRIC RANK
2.6%
SELF-CARE DISABILITY
0.3/ 100
METRIC RATING
258th/ 347
METRIC RANK
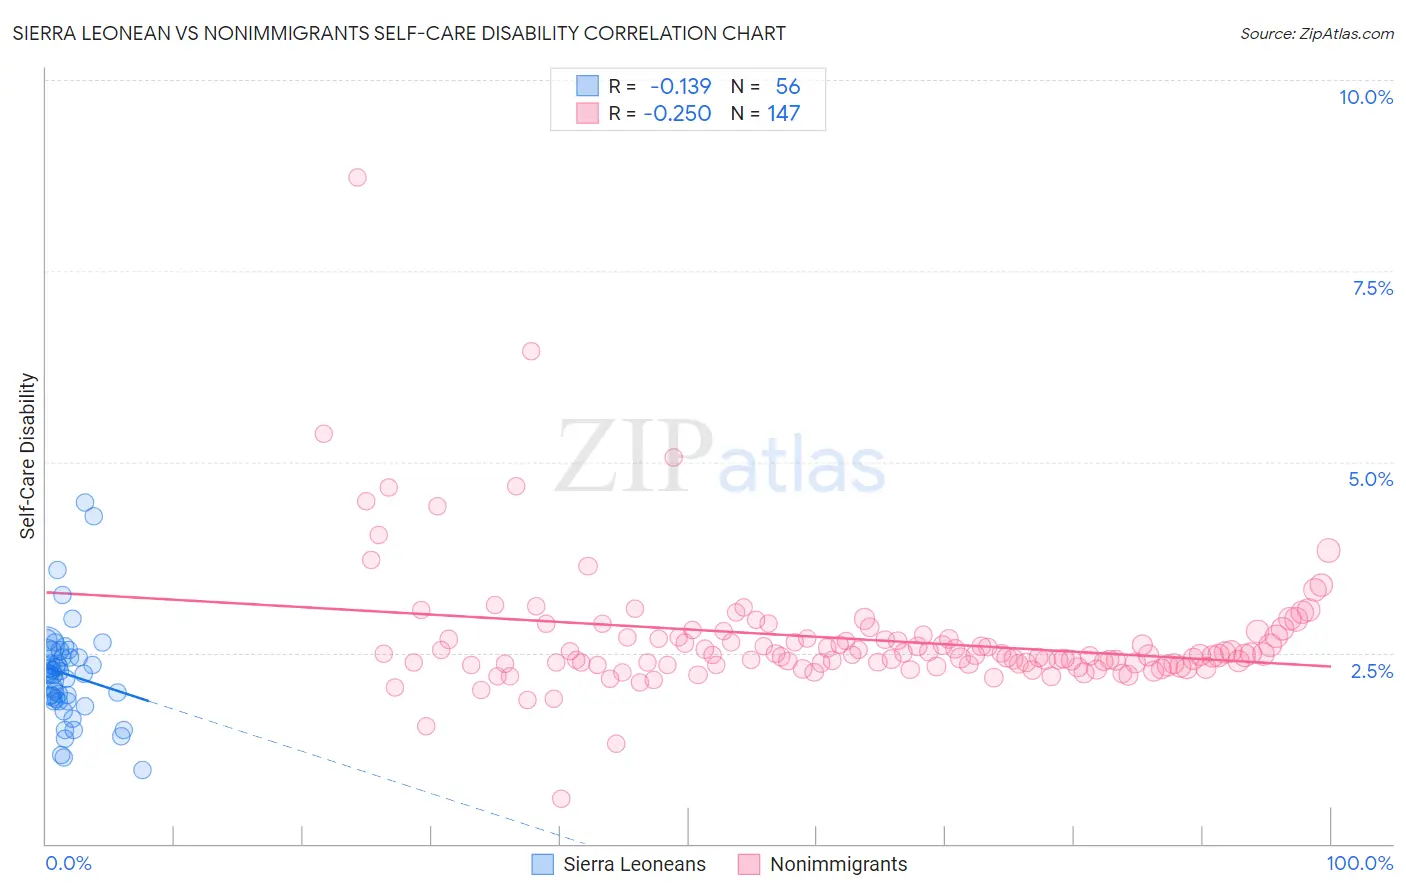
Sierra Leonean vs Nonimmigrants Self-Care Disability Correlation Chart
The statistical analysis conducted on geographies consisting of 83,322,147 people shows a poor negative correlation between the proportion of Sierra Leoneans and percentage of population with self-care disability in the United States with a correlation coefficient (R) of -0.139 and weighted average of 2.4%. Similarly, the statistical analysis conducted on geographies consisting of 581,524,838 people shows a weak negative correlation between the proportion of Nonimmigrants and percentage of population with self-care disability in the United States with a correlation coefficient (R) of -0.250 and weighted average of 2.6%, a difference of 12.3%.
Self-Care Disability Correlation Summary
| Measurement | Sierra Leonean | Nonimmigrants |
| Minimum | 0.96% | 0.58% |
| Maximum | 4.5% | 8.7% |
| Range | 3.5% | 8.1% |
| Mean | 2.2% | 2.7% |
| Median | 2.2% | 2.5% |
| Interquartile 25% (IQ1) | 1.9% | 2.3% |
| Interquartile 75% (IQ3) | 2.5% | 2.7% |
| Interquartile Range (IQR) | 0.60% | 0.36% |
| Standard Deviation (Sample) | 0.65% | 0.84% |
| Standard Deviation (Population) | 0.64% | 0.84% |
Similar Demographics by Self-Care Disability
Demographics Similar to Sierra Leoneans by Self-Care Disability
In terms of self-care disability, the demographic groups most similar to Sierra Leoneans are Lithuanian (2.4%, a difference of 0.0%), Immigrants from Congo (2.4%, a difference of 0.050%), Immigrants from Northern Africa (2.3%, a difference of 0.14%), Estonian (2.3%, a difference of 0.16%), and Immigrants from Czechoslovakia (2.4%, a difference of 0.19%).
| Demographics | Rating | Rank | Self-Care Disability |
| Chileans | 98.8 /100 | #80 | Exceptional 2.3% |
| Ugandans | 98.8 /100 | #81 | Exceptional 2.3% |
| Immigrants | Denmark | 98.8 /100 | #82 | Exceptional 2.3% |
| Indians (Asian) | 98.7 /100 | #83 | Exceptional 2.3% |
| Immigrants | Spain | 98.7 /100 | #84 | Exceptional 2.3% |
| Estonians | 98.3 /100 | #85 | Exceptional 2.3% |
| Immigrants | Northern Africa | 98.2 /100 | #86 | Exceptional 2.3% |
| Sierra Leoneans | 98.0 /100 | #87 | Exceptional 2.4% |
| Lithuanians | 98.0 /100 | #88 | Exceptional 2.4% |
| Immigrants | Congo | 98.0 /100 | #89 | Exceptional 2.4% |
| Immigrants | Czechoslovakia | 97.7 /100 | #90 | Exceptional 2.4% |
| Immigrants | Jordan | 97.7 /100 | #91 | Exceptional 2.4% |
| Icelanders | 97.4 /100 | #92 | Exceptional 2.4% |
| Immigrants | Latvia | 97.0 /100 | #93 | Exceptional 2.4% |
| Macedonians | 96.9 /100 | #94 | Exceptional 2.4% |
Demographics Similar to Nonimmigrants by Self-Care Disability
In terms of self-care disability, the demographic groups most similar to Nonimmigrants are Potawatomi (2.6%, a difference of 0.070%), Immigrants from Belarus (2.6%, a difference of 0.070%), Chippewa (2.6%, a difference of 0.11%), Arapaho (2.6%, a difference of 0.13%), and Immigrants from Central America (2.6%, a difference of 0.27%).
| Demographics | Rating | Rank | Self-Care Disability |
| Immigrants | Liberia | 0.4 /100 | #251 | Tragic 2.6% |
| Immigrants | Bangladesh | 0.4 /100 | #252 | Tragic 2.6% |
| Immigrants | Haiti | 0.3 /100 | #253 | Tragic 2.6% |
| Haitians | 0.3 /100 | #254 | Tragic 2.6% |
| Tsimshian | 0.3 /100 | #255 | Tragic 2.6% |
| Immigrants | Central America | 0.3 /100 | #256 | Tragic 2.6% |
| Potawatomi | 0.3 /100 | #257 | Tragic 2.6% |
| Immigrants | Nonimmigrants | 0.3 /100 | #258 | Tragic 2.6% |
| Immigrants | Belarus | 0.2 /100 | #259 | Tragic 2.6% |
| Chippewa | 0.2 /100 | #260 | Tragic 2.6% |
| Arapaho | 0.2 /100 | #261 | Tragic 2.6% |
| Shoshone | 0.2 /100 | #262 | Tragic 2.7% |
| Immigrants | Latin America | 0.2 /100 | #263 | Tragic 2.7% |
| Immigrants | Iran | 0.2 /100 | #264 | Tragic 2.7% |
| Immigrants | Nicaragua | 0.2 /100 | #265 | Tragic 2.7% |