Carpatho Rusyn vs Chinese Self-Care Disability
COMPARE
Carpatho Rusyn
Chinese
Self-Care Disability
Self-Care Disability Comparison
Carpatho Rusyns
Chinese
2.4%
SELF-CARE DISABILITY
94.4/ 100
METRIC RATING
105th/ 347
METRIC RANK
2.6%
SELF-CARE DISABILITY
2.9/ 100
METRIC RATING
226th/ 347
METRIC RANK
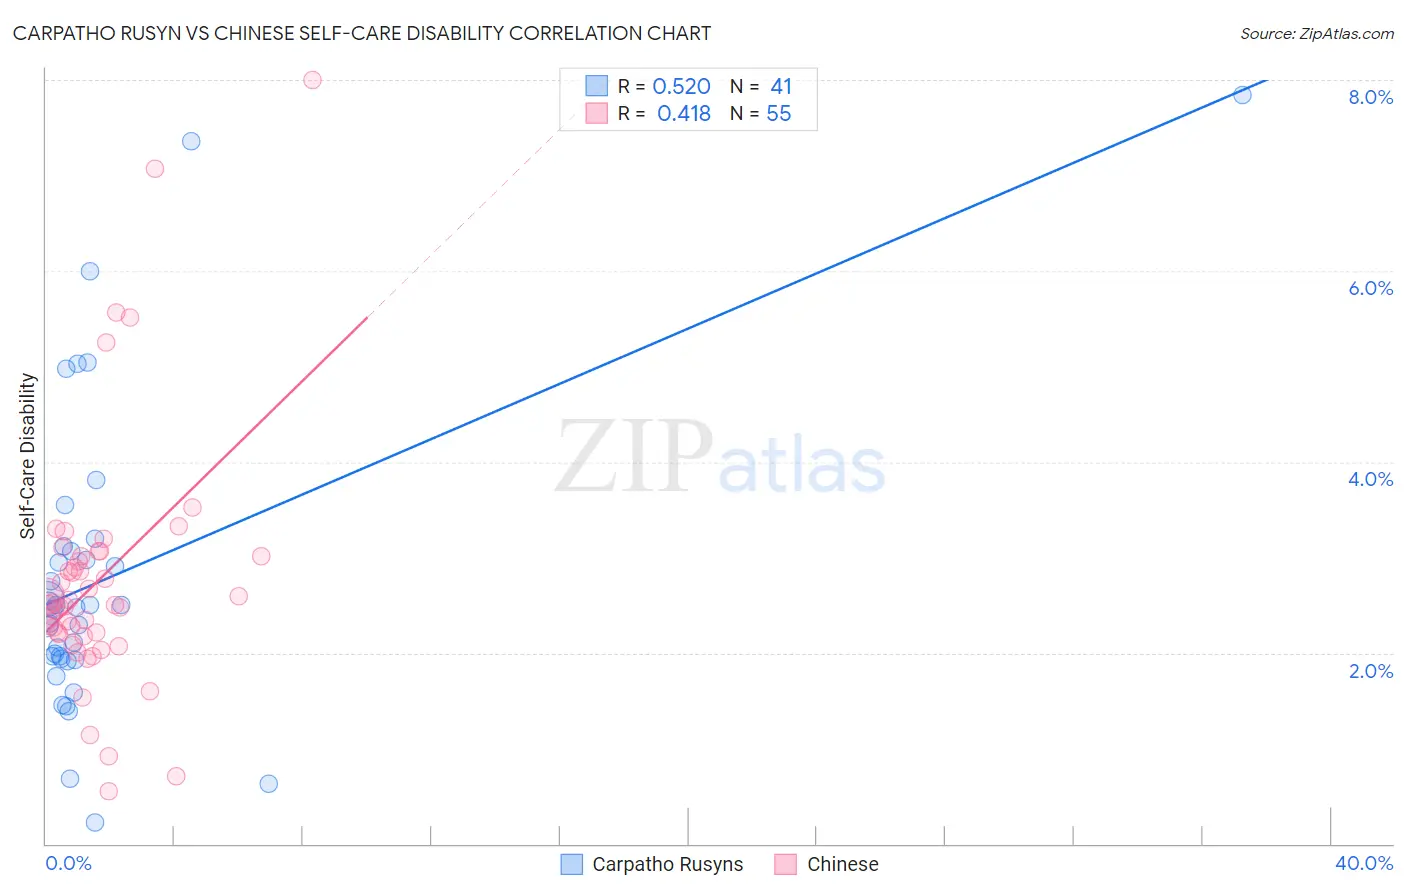
Carpatho Rusyn vs Chinese Self-Care Disability Correlation Chart
The statistical analysis conducted on geographies consisting of 58,870,733 people shows a substantial positive correlation between the proportion of Carpatho Rusyns and percentage of population with self-care disability in the United States with a correlation coefficient (R) of 0.520 and weighted average of 2.4%. Similarly, the statistical analysis conducted on geographies consisting of 64,799,357 people shows a moderate positive correlation between the proportion of Chinese and percentage of population with self-care disability in the United States with a correlation coefficient (R) of 0.418 and weighted average of 2.6%, a difference of 7.8%.
Self-Care Disability Correlation Summary
| Measurement | Carpatho Rusyn | Chinese |
| Minimum | 0.22% | 0.55% |
| Maximum | 7.8% | 8.0% |
| Range | 7.6% | 7.4% |
| Mean | 2.8% | 2.8% |
| Median | 2.5% | 2.5% |
| Interquartile 25% (IQ1) | 1.9% | 2.2% |
| Interquartile 75% (IQ3) | 3.1% | 3.0% |
| Interquartile Range (IQR) | 1.2% | 0.82% |
| Standard Deviation (Sample) | 1.6% | 1.3% |
| Standard Deviation (Population) | 1.6% | 1.3% |
Similar Demographics by Self-Care Disability
Demographics Similar to Carpatho Rusyns by Self-Care Disability
In terms of self-care disability, the demographic groups most similar to Carpatho Rusyns are Immigrants from Indonesia (2.4%, a difference of 0.010%), British (2.4%, a difference of 0.020%), Bhutanese (2.4%, a difference of 0.030%), Greek (2.4%, a difference of 0.050%), and Slovene (2.4%, a difference of 0.060%).
| Demographics | Rating | Rank | Self-Care Disability |
| Immigrants | Poland | 96.4 /100 | #98 | Exceptional 2.4% |
| Immigrants | Israel | 96.1 /100 | #99 | Exceptional 2.4% |
| Europeans | 95.8 /100 | #100 | Exceptional 2.4% |
| Immigrants | Scotland | 95.7 /100 | #101 | Exceptional 2.4% |
| Croatians | 95.0 /100 | #102 | Exceptional 2.4% |
| Alsatians | 94.9 /100 | #103 | Exceptional 2.4% |
| Bhutanese | 94.5 /100 | #104 | Exceptional 2.4% |
| Carpatho Rusyns | 94.4 /100 | #105 | Exceptional 2.4% |
| Immigrants | Indonesia | 94.3 /100 | #106 | Exceptional 2.4% |
| British | 94.3 /100 | #107 | Exceptional 2.4% |
| Greeks | 94.1 /100 | #108 | Exceptional 2.4% |
| Slovenes | 94.1 /100 | #109 | Exceptional 2.4% |
| Immigrants | Africa | 93.7 /100 | #110 | Exceptional 2.4% |
| Serbians | 93.6 /100 | #111 | Exceptional 2.4% |
| Scandinavians | 93.5 /100 | #112 | Exceptional 2.4% |
Demographics Similar to Chinese by Self-Care Disability
In terms of self-care disability, the demographic groups most similar to Chinese are Immigrants from Philippines (2.6%, a difference of 0.080%), Guatemalan (2.6%, a difference of 0.090%), Iraqi (2.6%, a difference of 0.10%), Guamanian/Chamorro (2.6%, a difference of 0.16%), and Immigrants from Ecuador (2.6%, a difference of 0.16%).
| Demographics | Rating | Rank | Self-Care Disability |
| Immigrants | Moldova | 4.0 /100 | #219 | Tragic 2.6% |
| Sub-Saharan Africans | 4.0 /100 | #220 | Tragic 2.6% |
| Hondurans | 3.8 /100 | #221 | Tragic 2.6% |
| Spaniards | 3.8 /100 | #222 | Tragic 2.6% |
| French Canadians | 3.8 /100 | #223 | Tragic 2.6% |
| Osage | 3.6 /100 | #224 | Tragic 2.6% |
| Iraqis | 3.2 /100 | #225 | Tragic 2.6% |
| Chinese | 2.9 /100 | #226 | Tragic 2.6% |
| Immigrants | Philippines | 2.7 /100 | #227 | Tragic 2.6% |
| Guatemalans | 2.7 /100 | #228 | Tragic 2.6% |
| Guamanians/Chamorros | 2.5 /100 | #229 | Tragic 2.6% |
| Immigrants | Ecuador | 2.5 /100 | #230 | Tragic 2.6% |
| Immigrants | Guatemala | 2.2 /100 | #231 | Tragic 2.6% |
| Albanians | 2.2 /100 | #232 | Tragic 2.6% |
| Liberians | 2.1 /100 | #233 | Tragic 2.6% |