Carpatho Rusyn vs Nonimmigrants Female Poverty Among 25-34 Year Olds
COMPARE
Carpatho Rusyn
Nonimmigrants
Female Poverty Among 25-34 Year Olds
Female Poverty Among 25-34 Year Olds Comparison
Carpatho Rusyns
Nonimmigrants
12.8%
FEMALE POVERTY AMONG 25-34 YEAR OLDS
93.0/ 100
METRIC RATING
120th/ 347
METRIC RANK
15.6%
FEMALE POVERTY AMONG 25-34 YEAR OLDS
0.1/ 100
METRIC RATING
273rd/ 347
METRIC RANK
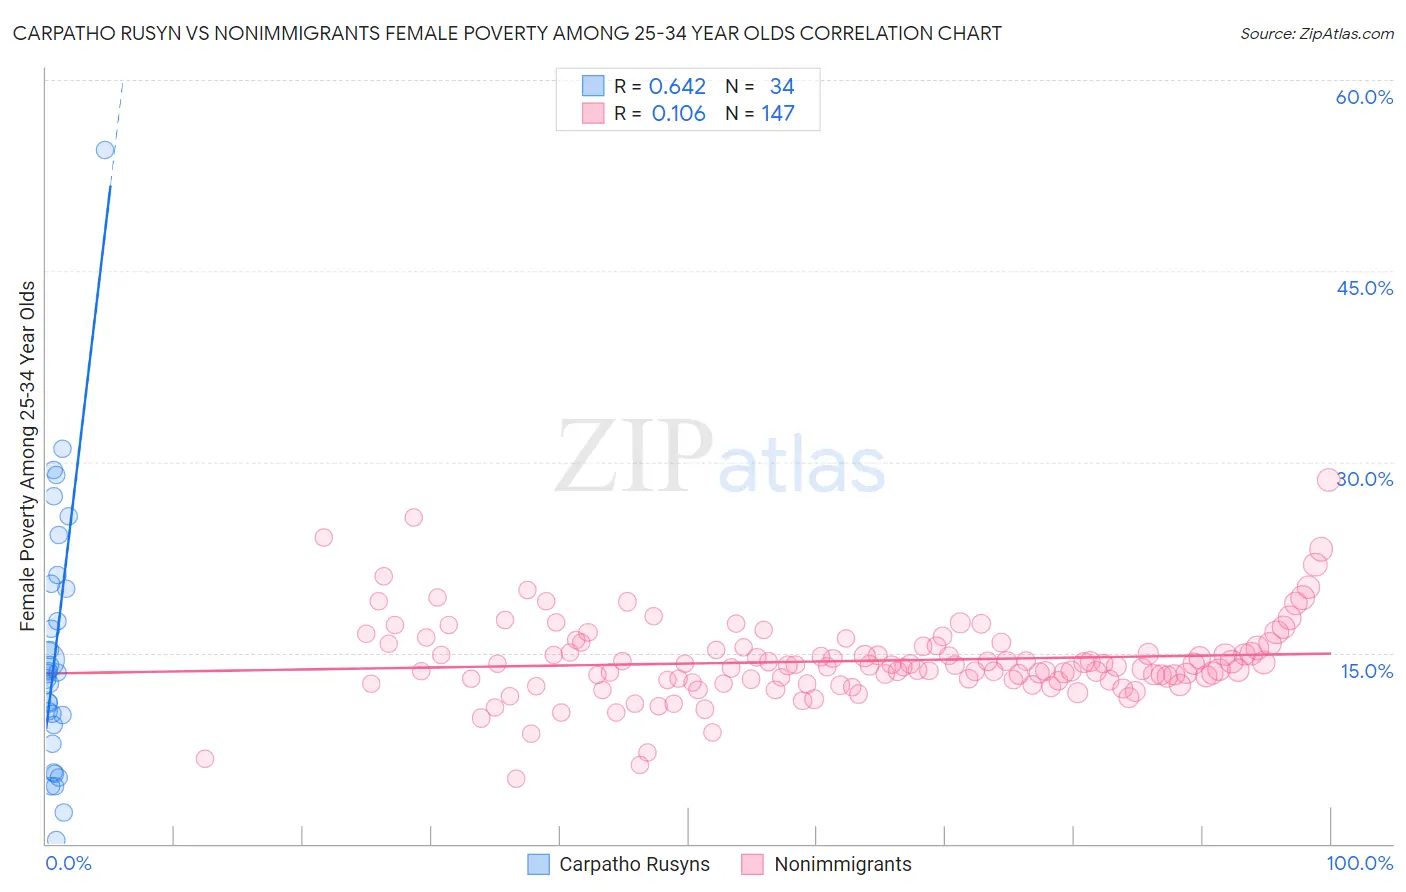
Carpatho Rusyn vs Nonimmigrants Female Poverty Among 25-34 Year Olds Correlation Chart
The statistical analysis conducted on geographies consisting of 58,469,179 people shows a significant positive correlation between the proportion of Carpatho Rusyns and poverty level among females between the ages 25 and 34 in the United States with a correlation coefficient (R) of 0.642 and weighted average of 12.8%. Similarly, the statistical analysis conducted on geographies consisting of 559,225,521 people shows a poor positive correlation between the proportion of Nonimmigrants and poverty level among females between the ages 25 and 34 in the United States with a correlation coefficient (R) of 0.106 and weighted average of 15.6%, a difference of 22.1%.
Female Poverty Among 25-34 Year Olds Correlation Summary
| Measurement | Carpatho Rusyn | Nonimmigrants |
| Minimum | 0.28% | 5.1% |
| Maximum | 54.5% | 28.6% |
| Range | 54.3% | 23.5% |
| Mean | 15.4% | 14.4% |
| Median | 13.4% | 14.0% |
| Interquartile 25% (IQ1) | 9.3% | 12.9% |
| Interquartile 75% (IQ3) | 20.4% | 15.5% |
| Interquartile Range (IQR) | 11.1% | 2.7% |
| Standard Deviation (Sample) | 10.6% | 3.2% |
| Standard Deviation (Population) | 10.5% | 3.2% |
Similar Demographics by Female Poverty Among 25-34 Year Olds
Demographics Similar to Carpatho Rusyns by Female Poverty Among 25-34 Year Olds
In terms of female poverty among 25-34 year olds, the demographic groups most similar to Carpatho Rusyns are Immigrants from Nepal (12.8%, a difference of 0.0%), Mongolian (12.8%, a difference of 0.010%), Immigrants from Kuwait (12.8%, a difference of 0.030%), Romanian (12.8%, a difference of 0.070%), and Immigrants from Western Asia (12.8%, a difference of 0.080%).
| Demographics | Rating | Rank | Female Poverty Among 25-34 Year Olds |
| Immigrants | Syria | 93.8 /100 | #113 | Exceptional 12.8% |
| Immigrants | Southern Europe | 93.6 /100 | #114 | Exceptional 12.8% |
| Immigrants | Brazil | 93.3 /100 | #115 | Exceptional 12.8% |
| Chileans | 93.2 /100 | #116 | Exceptional 12.8% |
| Immigrants | Kuwait | 93.1 /100 | #117 | Exceptional 12.8% |
| Mongolians | 93.0 /100 | #118 | Exceptional 12.8% |
| Immigrants | Nepal | 93.0 /100 | #119 | Exceptional 12.8% |
| Carpatho Rusyns | 93.0 /100 | #120 | Exceptional 12.8% |
| Romanians | 92.8 /100 | #121 | Exceptional 12.8% |
| Immigrants | Western Asia | 92.7 /100 | #122 | Exceptional 12.8% |
| Slovenes | 92.7 /100 | #123 | Exceptional 12.8% |
| Immigrants | Netherlands | 92.0 /100 | #124 | Exceptional 12.8% |
| Immigrants | Canada | 91.5 /100 | #125 | Exceptional 12.9% |
| Immigrants | Fiji | 91.2 /100 | #126 | Exceptional 12.9% |
| Czechs | 90.3 /100 | #127 | Exceptional 12.9% |
Demographics Similar to Nonimmigrants by Female Poverty Among 25-34 Year Olds
In terms of female poverty among 25-34 year olds, the demographic groups most similar to Nonimmigrants are Senegalese (15.6%, a difference of 0.11%), Cree (15.6%, a difference of 0.17%), British West Indian (15.6%, a difference of 0.18%), Subsaharan African (15.6%, a difference of 0.33%), and Immigrants from Caribbean (15.7%, a difference of 0.49%).
| Demographics | Rating | Rank | Female Poverty Among 25-34 Year Olds |
| Immigrants | Somalia | 0.1 /100 | #266 | Tragic 15.4% |
| Central Americans | 0.1 /100 | #267 | Tragic 15.5% |
| Immigrants | Senegal | 0.1 /100 | #268 | Tragic 15.6% |
| Sub-Saharan Africans | 0.1 /100 | #269 | Tragic 15.6% |
| British West Indians | 0.1 /100 | #270 | Tragic 15.6% |
| Cree | 0.1 /100 | #271 | Tragic 15.6% |
| Senegalese | 0.1 /100 | #272 | Tragic 15.6% |
| Immigrants | Nonimmigrants | 0.1 /100 | #273 | Tragic 15.6% |
| Immigrants | Caribbean | 0.0 /100 | #274 | Tragic 15.7% |
| Immigrants | Azores | 0.0 /100 | #275 | Tragic 15.8% |
| Immigrants | Zaire | 0.0 /100 | #276 | Tragic 15.8% |
| Immigrants | Micronesia | 0.0 /100 | #277 | Tragic 15.8% |
| French American Indians | 0.0 /100 | #278 | Tragic 15.9% |
| Fijians | 0.0 /100 | #279 | Tragic 15.9% |
| Bangladeshis | 0.0 /100 | #280 | Tragic 15.9% |