Carpatho Rusyn vs Nonimmigrants College, Under 1 year
COMPARE
Carpatho Rusyn
Nonimmigrants
College, Under 1 year
College, Under 1 year Comparison
Carpatho Rusyns
Nonimmigrants
67.9%
COLLEGE, UNDER 1 YEAR
96.8/ 100
METRIC RATING
103rd/ 347
METRIC RANK
62.9%
COLLEGE, UNDER 1 YEAR
3.0/ 100
METRIC RATING
230th/ 347
METRIC RANK
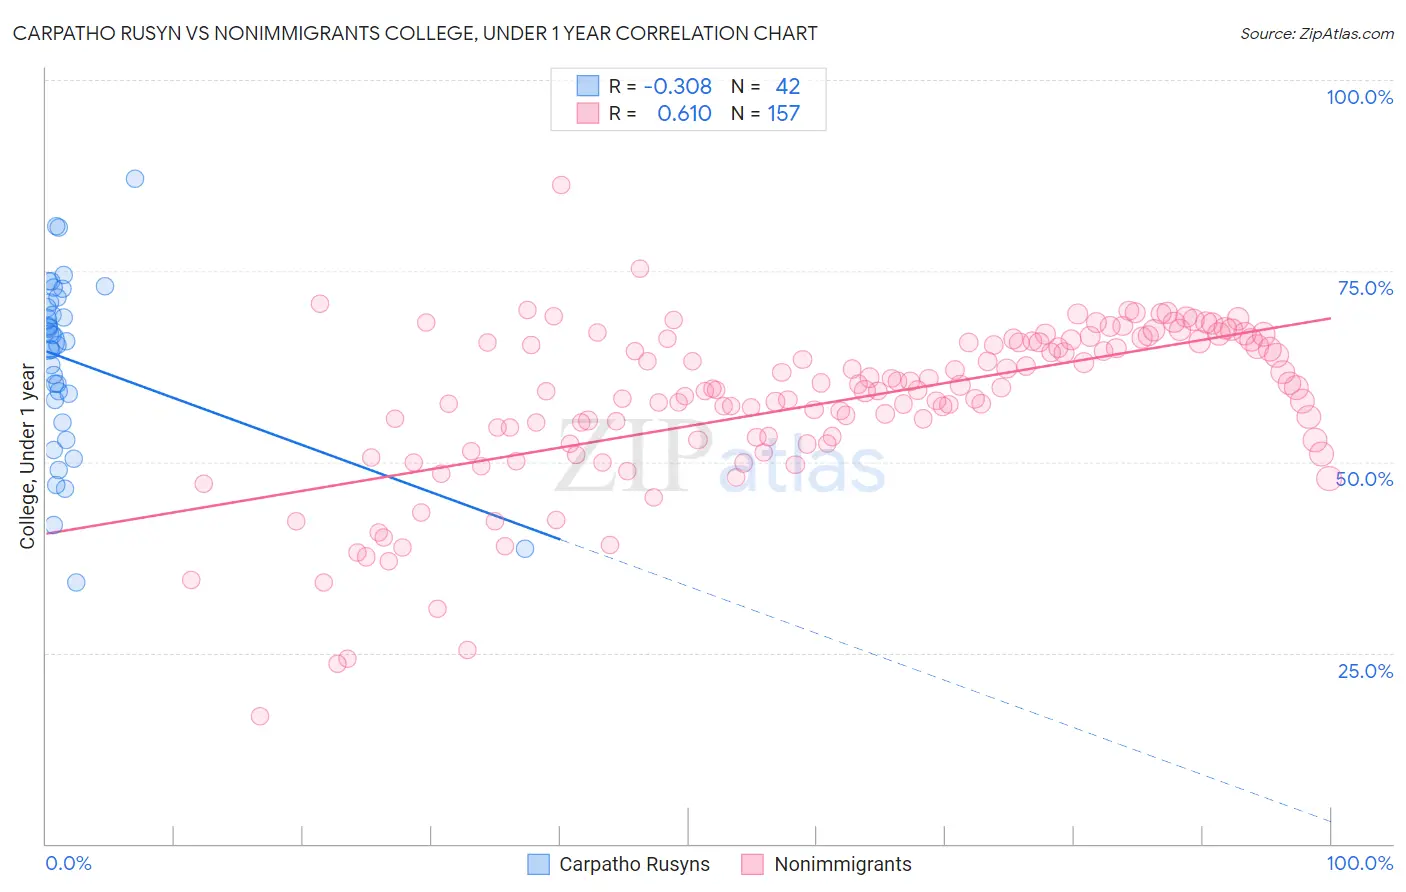
Carpatho Rusyn vs Nonimmigrants College, Under 1 year Correlation Chart
The statistical analysis conducted on geographies consisting of 58,871,690 people shows a mild negative correlation between the proportion of Carpatho Rusyns and percentage of population with at least college, under 1 year education in the United States with a correlation coefficient (R) of -0.308 and weighted average of 67.9%. Similarly, the statistical analysis conducted on geographies consisting of 585,317,870 people shows a significant positive correlation between the proportion of Nonimmigrants and percentage of population with at least college, under 1 year education in the United States with a correlation coefficient (R) of 0.610 and weighted average of 62.9%, a difference of 7.9%.
College, Under 1 year Correlation Summary
| Measurement | Carpatho Rusyn | Nonimmigrants |
| Minimum | 34.2% | 16.7% |
| Maximum | 87.0% | 86.3% |
| Range | 52.8% | 69.6% |
| Mean | 63.3% | 57.6% |
| Median | 65.8% | 59.4% |
| Interquartile 25% (IQ1) | 58.1% | 52.7% |
| Interquartile 75% (IQ3) | 70.8% | 65.7% |
| Interquartile Range (IQR) | 12.7% | 13.0% |
| Standard Deviation (Sample) | 11.5% | 10.8% |
| Standard Deviation (Population) | 11.3% | 10.8% |
Similar Demographics by College, Under 1 year
Demographics Similar to Carpatho Rusyns by College, Under 1 year
In terms of college, under 1 year, the demographic groups most similar to Carpatho Rusyns are Immigrants from Eastern Europe (67.9%, a difference of 0.010%), Palestinian (67.9%, a difference of 0.010%), Immigrants from Argentina (67.9%, a difference of 0.060%), Immigrants from Bolivia (67.9%, a difference of 0.070%), and Immigrants from Western Asia (67.8%, a difference of 0.070%).
| Demographics | Rating | Rank | College, Under 1 year |
| Jordanians | 97.4 /100 | #96 | Exceptional 68.0% |
| Immigrants | Ethiopia | 97.3 /100 | #97 | Exceptional 68.0% |
| Paraguayans | 97.1 /100 | #98 | Exceptional 67.9% |
| Immigrants | Bolivia | 97.0 /100 | #99 | Exceptional 67.9% |
| Immigrants | Argentina | 97.0 /100 | #100 | Exceptional 67.9% |
| Immigrants | Eastern Europe | 96.9 /100 | #101 | Exceptional 67.9% |
| Palestinians | 96.9 /100 | #102 | Exceptional 67.9% |
| Carpatho Rusyns | 96.8 /100 | #103 | Exceptional 67.9% |
| Immigrants | Western Asia | 96.6 /100 | #104 | Exceptional 67.8% |
| Afghans | 96.6 /100 | #105 | Exceptional 67.8% |
| Immigrants | Croatia | 96.6 /100 | #106 | Exceptional 67.8% |
| Austrians | 96.4 /100 | #107 | Exceptional 67.8% |
| Immigrants | Egypt | 96.0 /100 | #108 | Exceptional 67.7% |
| Scandinavians | 95.8 /100 | #109 | Exceptional 67.7% |
| Assyrians/Chaldeans/Syriacs | 95.8 /100 | #110 | Exceptional 67.7% |
Demographics Similar to Nonimmigrants by College, Under 1 year
In terms of college, under 1 year, the demographic groups most similar to Nonimmigrants are Liberian (63.0%, a difference of 0.070%), Samoan (63.0%, a difference of 0.13%), Immigrants from Ghana (63.1%, a difference of 0.24%), Immigrants from Western Africa (62.8%, a difference of 0.24%), and Immigrants from Colombia (63.1%, a difference of 0.33%).
| Demographics | Rating | Rank | College, Under 1 year |
| Immigrants | Costa Rica | 4.5 /100 | #223 | Tragic 63.2% |
| Sub-Saharan Africans | 4.4 /100 | #224 | Tragic 63.2% |
| Immigrants | Peru | 4.0 /100 | #225 | Tragic 63.1% |
| Immigrants | Colombia | 4.0 /100 | #226 | Tragic 63.1% |
| Immigrants | Ghana | 3.7 /100 | #227 | Tragic 63.1% |
| Samoans | 3.3 /100 | #228 | Tragic 63.0% |
| Liberians | 3.2 /100 | #229 | Tragic 63.0% |
| Immigrants | Nonimmigrants | 3.0 /100 | #230 | Tragic 62.9% |
| Immigrants | Western Africa | 2.4 /100 | #231 | Tragic 62.8% |
| Osage | 2.2 /100 | #232 | Tragic 62.7% |
| Iroquois | 2.0 /100 | #233 | Tragic 62.6% |
| Chippewa | 2.0 /100 | #234 | Tragic 62.6% |
| Spanish Americans | 1.9 /100 | #235 | Tragic 62.6% |
| Immigrants | Immigrants | 1.7 /100 | #236 | Tragic 62.5% |
| Immigrants | Burma/Myanmar | 1.6 /100 | #237 | Tragic 62.5% |