Carpatho Rusyn vs Immigrants from Spain Self-Care Disability
COMPARE
Carpatho Rusyn
Immigrants from Spain
Self-Care Disability
Self-Care Disability Comparison
Carpatho Rusyns
Immigrants from Spain
2.4%
SELF-CARE DISABILITY
94.4/ 100
METRIC RATING
105th/ 347
METRIC RANK
2.3%
SELF-CARE DISABILITY
98.7/ 100
METRIC RATING
84th/ 347
METRIC RANK
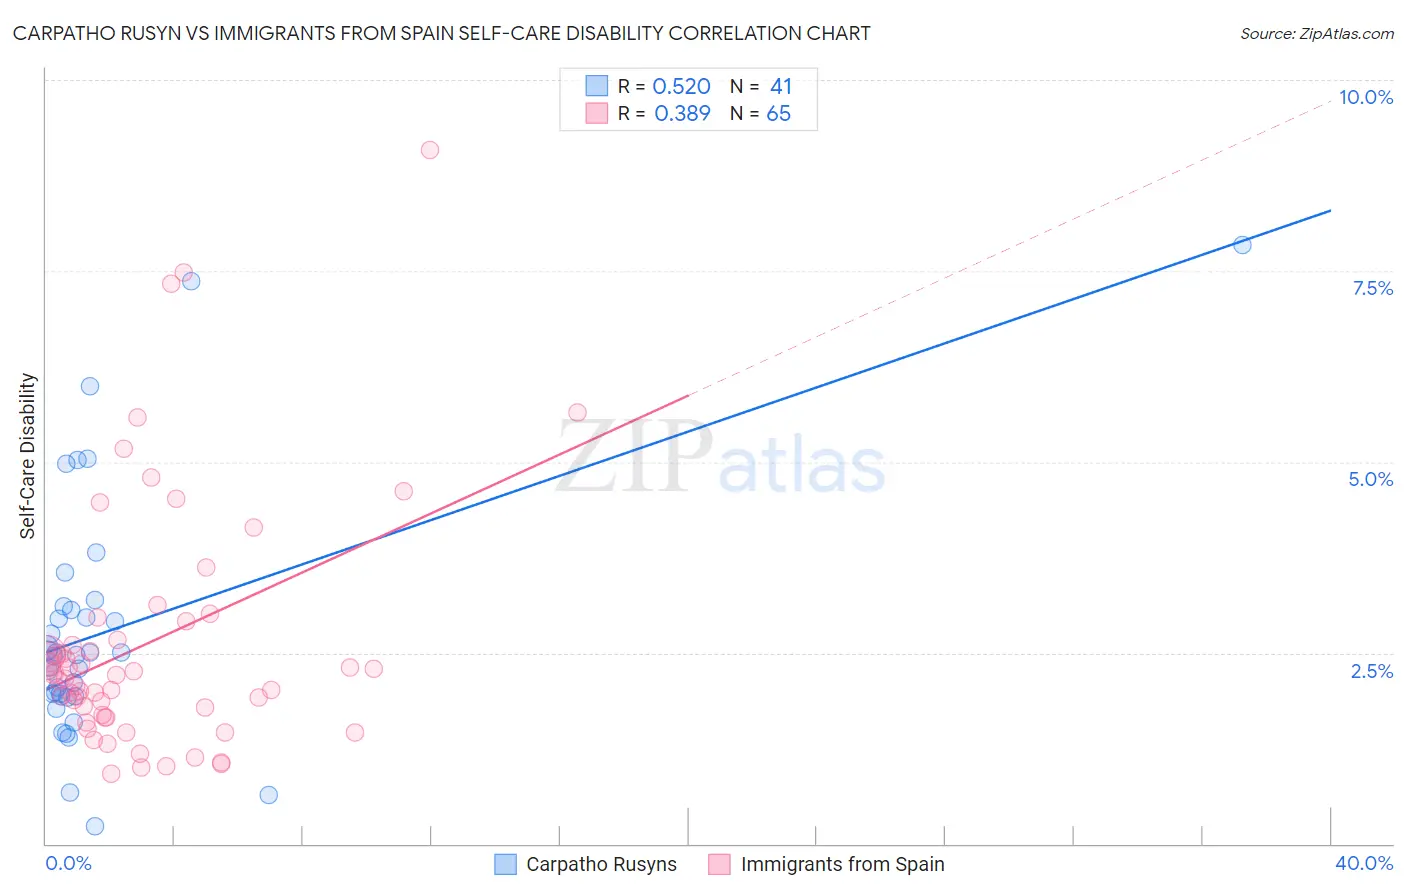
Carpatho Rusyn vs Immigrants from Spain Self-Care Disability Correlation Chart
The statistical analysis conducted on geographies consisting of 58,870,733 people shows a substantial positive correlation between the proportion of Carpatho Rusyns and percentage of population with self-care disability in the United States with a correlation coefficient (R) of 0.520 and weighted average of 2.4%. Similarly, the statistical analysis conducted on geographies consisting of 239,524,195 people shows a mild positive correlation between the proportion of Immigrants from Spain and percentage of population with self-care disability in the United States with a correlation coefficient (R) of 0.389 and weighted average of 2.3%, a difference of 1.9%.
Self-Care Disability Correlation Summary
| Measurement | Carpatho Rusyn | Immigrants from Spain |
| Minimum | 0.22% | 0.91% |
| Maximum | 7.8% | 9.1% |
| Range | 7.6% | 8.2% |
| Mean | 2.8% | 2.6% |
| Median | 2.5% | 2.2% |
| Interquartile 25% (IQ1) | 1.9% | 1.7% |
| Interquartile 75% (IQ3) | 3.1% | 2.8% |
| Interquartile Range (IQR) | 1.2% | 1.1% |
| Standard Deviation (Sample) | 1.6% | 1.6% |
| Standard Deviation (Population) | 1.6% | 1.6% |
Similar Demographics by Self-Care Disability
Demographics Similar to Carpatho Rusyns by Self-Care Disability
In terms of self-care disability, the demographic groups most similar to Carpatho Rusyns are Immigrants from Indonesia (2.4%, a difference of 0.010%), British (2.4%, a difference of 0.020%), Bhutanese (2.4%, a difference of 0.030%), Greek (2.4%, a difference of 0.050%), and Slovene (2.4%, a difference of 0.060%).
| Demographics | Rating | Rank | Self-Care Disability |
| Immigrants | Poland | 96.4 /100 | #98 | Exceptional 2.4% |
| Immigrants | Israel | 96.1 /100 | #99 | Exceptional 2.4% |
| Europeans | 95.8 /100 | #100 | Exceptional 2.4% |
| Immigrants | Scotland | 95.7 /100 | #101 | Exceptional 2.4% |
| Croatians | 95.0 /100 | #102 | Exceptional 2.4% |
| Alsatians | 94.9 /100 | #103 | Exceptional 2.4% |
| Bhutanese | 94.5 /100 | #104 | Exceptional 2.4% |
| Carpatho Rusyns | 94.4 /100 | #105 | Exceptional 2.4% |
| Immigrants | Indonesia | 94.3 /100 | #106 | Exceptional 2.4% |
| British | 94.3 /100 | #107 | Exceptional 2.4% |
| Greeks | 94.1 /100 | #108 | Exceptional 2.4% |
| Slovenes | 94.1 /100 | #109 | Exceptional 2.4% |
| Immigrants | Africa | 93.7 /100 | #110 | Exceptional 2.4% |
| Serbians | 93.6 /100 | #111 | Exceptional 2.4% |
| Scandinavians | 93.5 /100 | #112 | Exceptional 2.4% |
Demographics Similar to Immigrants from Spain by Self-Care Disability
In terms of self-care disability, the demographic groups most similar to Immigrants from Spain are Indian (Asian) (2.3%, a difference of 0.040%), Immigrants from Denmark (2.3%, a difference of 0.10%), Ugandan (2.3%, a difference of 0.11%), Chilean (2.3%, a difference of 0.17%), and Estonian (2.3%, a difference of 0.34%).
| Demographics | Rating | Rank | Self-Care Disability |
| Immigrants | Middle Africa | 99.0 /100 | #77 | Exceptional 2.3% |
| Immigrants | Ireland | 99.0 /100 | #78 | Exceptional 2.3% |
| Immigrants | Kenya | 99.0 /100 | #79 | Exceptional 2.3% |
| Chileans | 98.8 /100 | #80 | Exceptional 2.3% |
| Ugandans | 98.8 /100 | #81 | Exceptional 2.3% |
| Immigrants | Denmark | 98.8 /100 | #82 | Exceptional 2.3% |
| Indians (Asian) | 98.7 /100 | #83 | Exceptional 2.3% |
| Immigrants | Spain | 98.7 /100 | #84 | Exceptional 2.3% |
| Estonians | 98.3 /100 | #85 | Exceptional 2.3% |
| Immigrants | Northern Africa | 98.2 /100 | #86 | Exceptional 2.3% |
| Sierra Leoneans | 98.0 /100 | #87 | Exceptional 2.4% |
| Lithuanians | 98.0 /100 | #88 | Exceptional 2.4% |
| Immigrants | Congo | 98.0 /100 | #89 | Exceptional 2.4% |
| Immigrants | Czechoslovakia | 97.7 /100 | #90 | Exceptional 2.4% |
| Immigrants | Jordan | 97.7 /100 | #91 | Exceptional 2.4% |