Black/African American vs Immigrants from Ireland Disability Age 5 to 17
COMPARE
Black/African American
Immigrants from Ireland
Disability Age 5 to 17
Disability Age 5 to 17 Comparison
Blacks/African Americans
Immigrants from Ireland
6.8%
DISABILITY AGE 5 TO 17
0.0/ 100
METRIC RATING
333rd/ 347
METRIC RANK
5.2%
DISABILITY AGE 5 TO 17
99.8/ 100
METRIC RATING
62nd/ 347
METRIC RANK
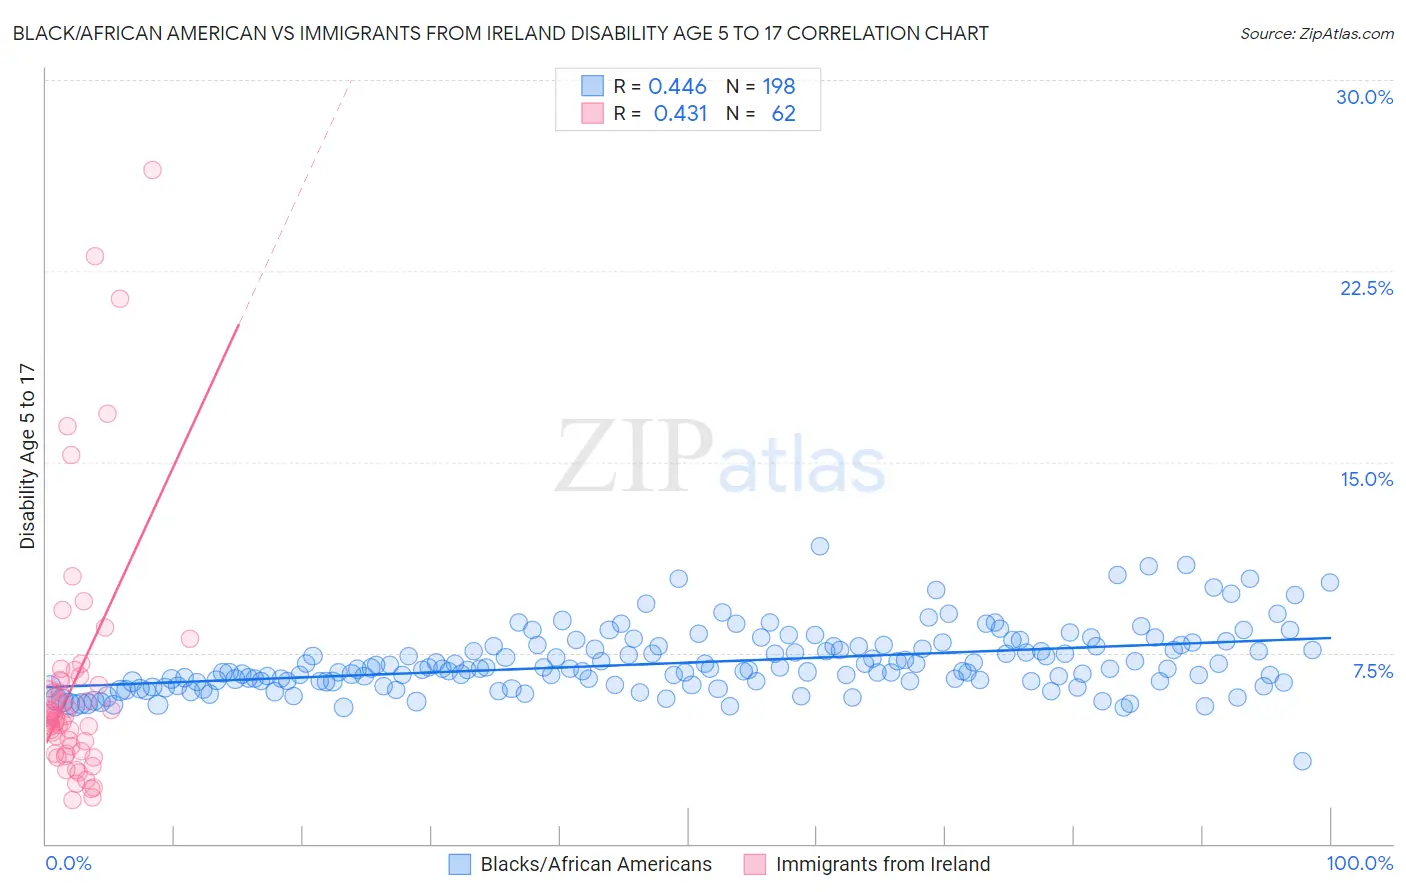
Black/African American vs Immigrants from Ireland Disability Age 5 to 17 Correlation Chart
The statistical analysis conducted on geographies consisting of 554,198,505 people shows a moderate positive correlation between the proportion of Blacks/African Americans and percentage of population with a disability between the ages 5 and 17 in the United States with a correlation coefficient (R) of 0.446 and weighted average of 6.8%. Similarly, the statistical analysis conducted on geographies consisting of 239,046,676 people shows a moderate positive correlation between the proportion of Immigrants from Ireland and percentage of population with a disability between the ages 5 and 17 in the United States with a correlation coefficient (R) of 0.431 and weighted average of 5.2%, a difference of 30.7%.
Disability Age 5 to 17 Correlation Summary
| Measurement | Black/African American | Immigrants from Ireland |
| Minimum | 3.3% | 1.7% |
| Maximum | 11.7% | 26.5% |
| Range | 8.4% | 24.8% |
| Mean | 7.1% | 6.4% |
| Median | 6.8% | 5.0% |
| Interquartile 25% (IQ1) | 6.3% | 3.6% |
| Interquartile 75% (IQ3) | 7.7% | 6.4% |
| Interquartile Range (IQR) | 1.4% | 2.8% |
| Standard Deviation (Sample) | 1.2% | 5.0% |
| Standard Deviation (Population) | 1.2% | 4.9% |
Similar Demographics by Disability Age 5 to 17
Demographics Similar to Blacks/African Americans by Disability Age 5 to 17
In terms of disability age 5 to 17, the demographic groups most similar to Blacks/African Americans are Seminole (6.8%, a difference of 0.050%), Immigrants from the Azores (6.7%, a difference of 0.59%), French Canadian (6.7%, a difference of 0.61%), Dutch West Indian (6.7%, a difference of 0.69%), and Ottawa (6.8%, a difference of 0.75%).
| Demographics | Rating | Rank | Disability Age 5 to 17 |
| Potawatomi | 0.0 /100 | #326 | Tragic 6.5% |
| French American Indians | 0.0 /100 | #327 | Tragic 6.6% |
| Pennsylvania Germans | 0.0 /100 | #328 | Tragic 6.6% |
| Blackfeet | 0.0 /100 | #329 | Tragic 6.6% |
| Dutch West Indians | 0.0 /100 | #330 | Tragic 6.7% |
| French Canadians | 0.0 /100 | #331 | Tragic 6.7% |
| Immigrants | Azores | 0.0 /100 | #332 | Tragic 6.7% |
| Blacks/African Americans | 0.0 /100 | #333 | Tragic 6.8% |
| Seminole | 0.0 /100 | #334 | Tragic 6.8% |
| Ottawa | 0.0 /100 | #335 | Tragic 6.8% |
| Chickasaw | 0.0 /100 | #336 | Tragic 6.8% |
| Creek | 0.0 /100 | #337 | Tragic 6.9% |
| Iroquois | 0.0 /100 | #338 | Tragic 6.9% |
| Choctaw | 0.0 /100 | #339 | Tragic 6.9% |
| Cherokee | 0.0 /100 | #340 | Tragic 6.9% |
Demographics Similar to Immigrants from Ireland by Disability Age 5 to 17
In terms of disability age 5 to 17, the demographic groups most similar to Immigrants from Ireland are Immigrants from Switzerland (5.2%, a difference of 0.090%), Immigrants from Bangladesh (5.2%, a difference of 0.11%), Immigrants from South Eastern Asia (5.2%, a difference of 0.14%), Immigrants from Greece (5.2%, a difference of 0.15%), and Palestinian (5.2%, a difference of 0.19%).
| Demographics | Rating | Rank | Disability Age 5 to 17 |
| Laotians | 99.9 /100 | #55 | Exceptional 5.1% |
| Immigrants | Turkey | 99.9 /100 | #56 | Exceptional 5.1% |
| Immigrants | Poland | 99.9 /100 | #57 | Exceptional 5.1% |
| Immigrants | Ukraine | 99.9 /100 | #58 | Exceptional 5.1% |
| Immigrants | North Macedonia | 99.9 /100 | #59 | Exceptional 5.1% |
| Immigrants | Eastern Europe | 99.9 /100 | #60 | Exceptional 5.1% |
| Immigrants | Switzerland | 99.8 /100 | #61 | Exceptional 5.2% |
| Immigrants | Ireland | 99.8 /100 | #62 | Exceptional 5.2% |
| Immigrants | Bangladesh | 99.8 /100 | #63 | Exceptional 5.2% |
| Immigrants | South Eastern Asia | 99.8 /100 | #64 | Exceptional 5.2% |
| Immigrants | Greece | 99.8 /100 | #65 | Exceptional 5.2% |
| Palestinians | 99.8 /100 | #66 | Exceptional 5.2% |
| Macedonians | 99.8 /100 | #67 | Exceptional 5.2% |
| Immigrants | Syria | 99.7 /100 | #68 | Exceptional 5.2% |
| Guyanese | 99.7 /100 | #69 | Exceptional 5.2% |