Immigrants from Dominican Republic vs Immigrants from Ireland Disability Age 5 to 17
COMPARE
Immigrants from Dominican Republic
Immigrants from Ireland
Disability Age 5 to 17
Disability Age 5 to 17 Comparison
Immigrants from Dominican Republic
Immigrants from Ireland
6.4%
DISABILITY AGE 5 TO 17
0.0/ 100
METRIC RATING
316th/ 347
METRIC RANK
5.2%
DISABILITY AGE 5 TO 17
99.8/ 100
METRIC RATING
62nd/ 347
METRIC RANK
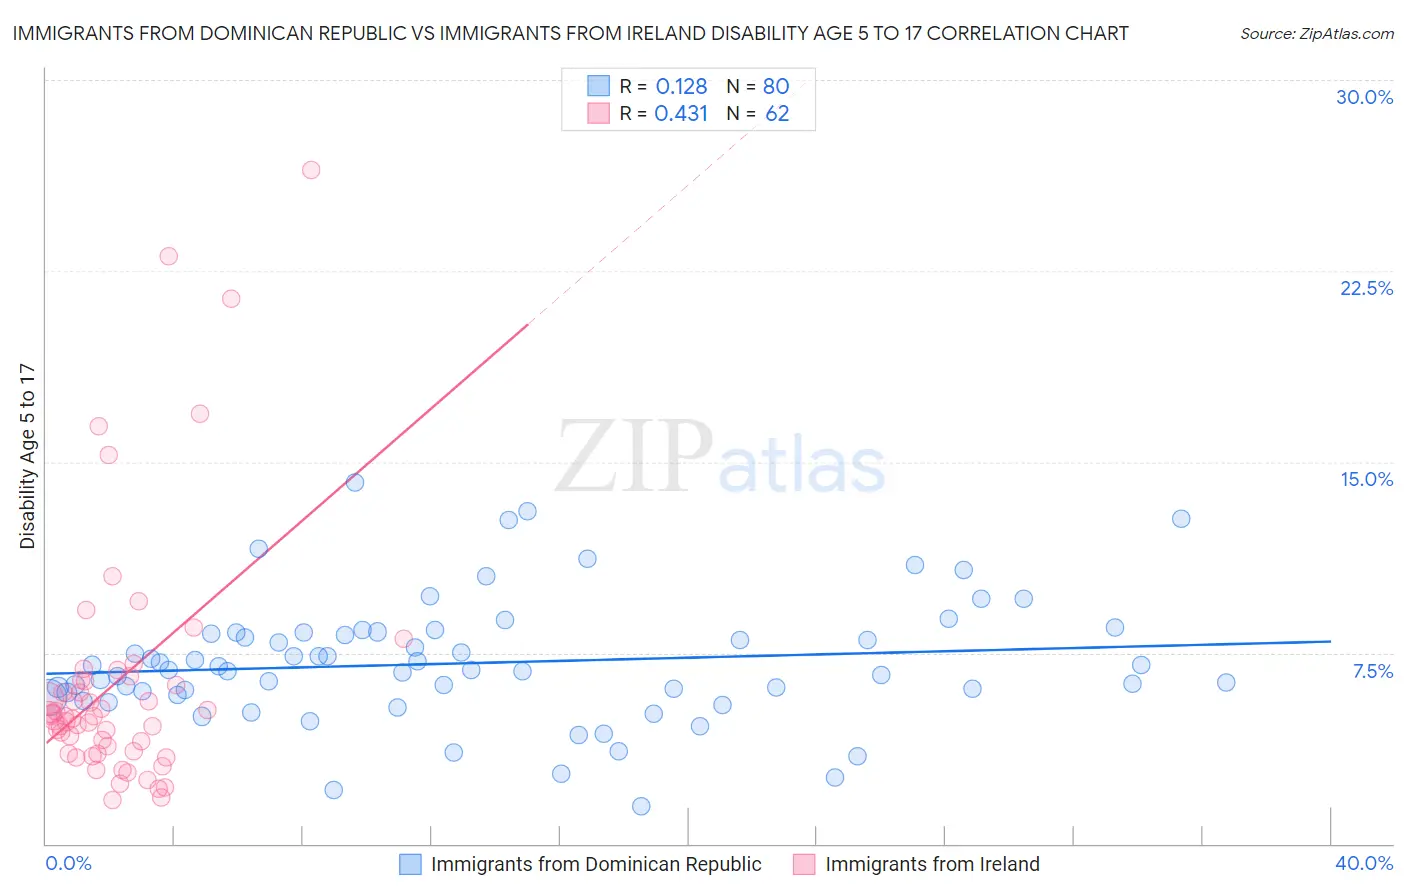
Immigrants from Dominican Republic vs Immigrants from Ireland Disability Age 5 to 17 Correlation Chart
The statistical analysis conducted on geographies consisting of 273,384,588 people shows a poor positive correlation between the proportion of Immigrants from Dominican Republic and percentage of population with a disability between the ages 5 and 17 in the United States with a correlation coefficient (R) of 0.128 and weighted average of 6.4%. Similarly, the statistical analysis conducted on geographies consisting of 239,046,676 people shows a moderate positive correlation between the proportion of Immigrants from Ireland and percentage of population with a disability between the ages 5 and 17 in the United States with a correlation coefficient (R) of 0.431 and weighted average of 5.2%, a difference of 24.5%.
Disability Age 5 to 17 Correlation Summary
| Measurement | Immigrants from Dominican Republic | Immigrants from Ireland |
| Minimum | 1.5% | 1.7% |
| Maximum | 14.2% | 26.5% |
| Range | 12.7% | 24.8% |
| Mean | 7.1% | 6.4% |
| Median | 6.8% | 5.0% |
| Interquartile 25% (IQ1) | 5.9% | 3.6% |
| Interquartile 75% (IQ3) | 8.3% | 6.4% |
| Interquartile Range (IQR) | 2.4% | 2.8% |
| Standard Deviation (Sample) | 2.4% | 5.0% |
| Standard Deviation (Population) | 2.4% | 4.9% |
Similar Demographics by Disability Age 5 to 17
Demographics Similar to Immigrants from Dominican Republic by Disability Age 5 to 17
In terms of disability age 5 to 17, the demographic groups most similar to Immigrants from Dominican Republic are Kiowa (6.4%, a difference of 0.13%), Comanche (6.4%, a difference of 0.16%), Immigrants from Portugal (6.4%, a difference of 0.18%), French (6.4%, a difference of 0.36%), and Delaware (6.5%, a difference of 0.71%).
| Demographics | Rating | Rank | Disability Age 5 to 17 |
| Hmong | 0.0 /100 | #309 | Tragic 6.3% |
| Alaskan Athabascans | 0.0 /100 | #310 | Tragic 6.3% |
| Immigrants | Dominica | 0.0 /100 | #311 | Tragic 6.3% |
| Bermudans | 0.0 /100 | #312 | Tragic 6.4% |
| Apache | 0.0 /100 | #313 | Tragic 6.4% |
| French | 0.0 /100 | #314 | Tragic 6.4% |
| Immigrants | Portugal | 0.0 /100 | #315 | Tragic 6.4% |
| Immigrants | Dominican Republic | 0.0 /100 | #316 | Tragic 6.4% |
| Kiowa | 0.0 /100 | #317 | Tragic 6.4% |
| Comanche | 0.0 /100 | #318 | Tragic 6.4% |
| Delaware | 0.0 /100 | #319 | Tragic 6.5% |
| Africans | 0.0 /100 | #320 | Tragic 6.5% |
| Tohono O'odham | 0.0 /100 | #321 | Tragic 6.5% |
| Slovaks | 0.0 /100 | #322 | Tragic 6.5% |
| Osage | 0.0 /100 | #323 | Tragic 6.5% |
Demographics Similar to Immigrants from Ireland by Disability Age 5 to 17
In terms of disability age 5 to 17, the demographic groups most similar to Immigrants from Ireland are Immigrants from Switzerland (5.2%, a difference of 0.090%), Immigrants from Bangladesh (5.2%, a difference of 0.11%), Immigrants from South Eastern Asia (5.2%, a difference of 0.14%), Immigrants from Greece (5.2%, a difference of 0.15%), and Palestinian (5.2%, a difference of 0.19%).
| Demographics | Rating | Rank | Disability Age 5 to 17 |
| Laotians | 99.9 /100 | #55 | Exceptional 5.1% |
| Immigrants | Turkey | 99.9 /100 | #56 | Exceptional 5.1% |
| Immigrants | Poland | 99.9 /100 | #57 | Exceptional 5.1% |
| Immigrants | Ukraine | 99.9 /100 | #58 | Exceptional 5.1% |
| Immigrants | North Macedonia | 99.9 /100 | #59 | Exceptional 5.1% |
| Immigrants | Eastern Europe | 99.9 /100 | #60 | Exceptional 5.1% |
| Immigrants | Switzerland | 99.8 /100 | #61 | Exceptional 5.2% |
| Immigrants | Ireland | 99.8 /100 | #62 | Exceptional 5.2% |
| Immigrants | Bangladesh | 99.8 /100 | #63 | Exceptional 5.2% |
| Immigrants | South Eastern Asia | 99.8 /100 | #64 | Exceptional 5.2% |
| Immigrants | Greece | 99.8 /100 | #65 | Exceptional 5.2% |
| Palestinians | 99.8 /100 | #66 | Exceptional 5.2% |
| Macedonians | 99.8 /100 | #67 | Exceptional 5.2% |
| Immigrants | Syria | 99.7 /100 | #68 | Exceptional 5.2% |
| Guyanese | 99.7 /100 | #69 | Exceptional 5.2% |