Lumbee vs Immigrants from Ireland Disability Age 5 to 17
COMPARE
Lumbee
Immigrants from Ireland
Disability Age 5 to 17
Disability Age 5 to 17 Comparison
Lumbee
Immigrants from Ireland
6.2%
DISABILITY AGE 5 TO 17
0.0/ 100
METRIC RATING
298th/ 347
METRIC RANK
5.2%
DISABILITY AGE 5 TO 17
99.8/ 100
METRIC RATING
62nd/ 347
METRIC RANK
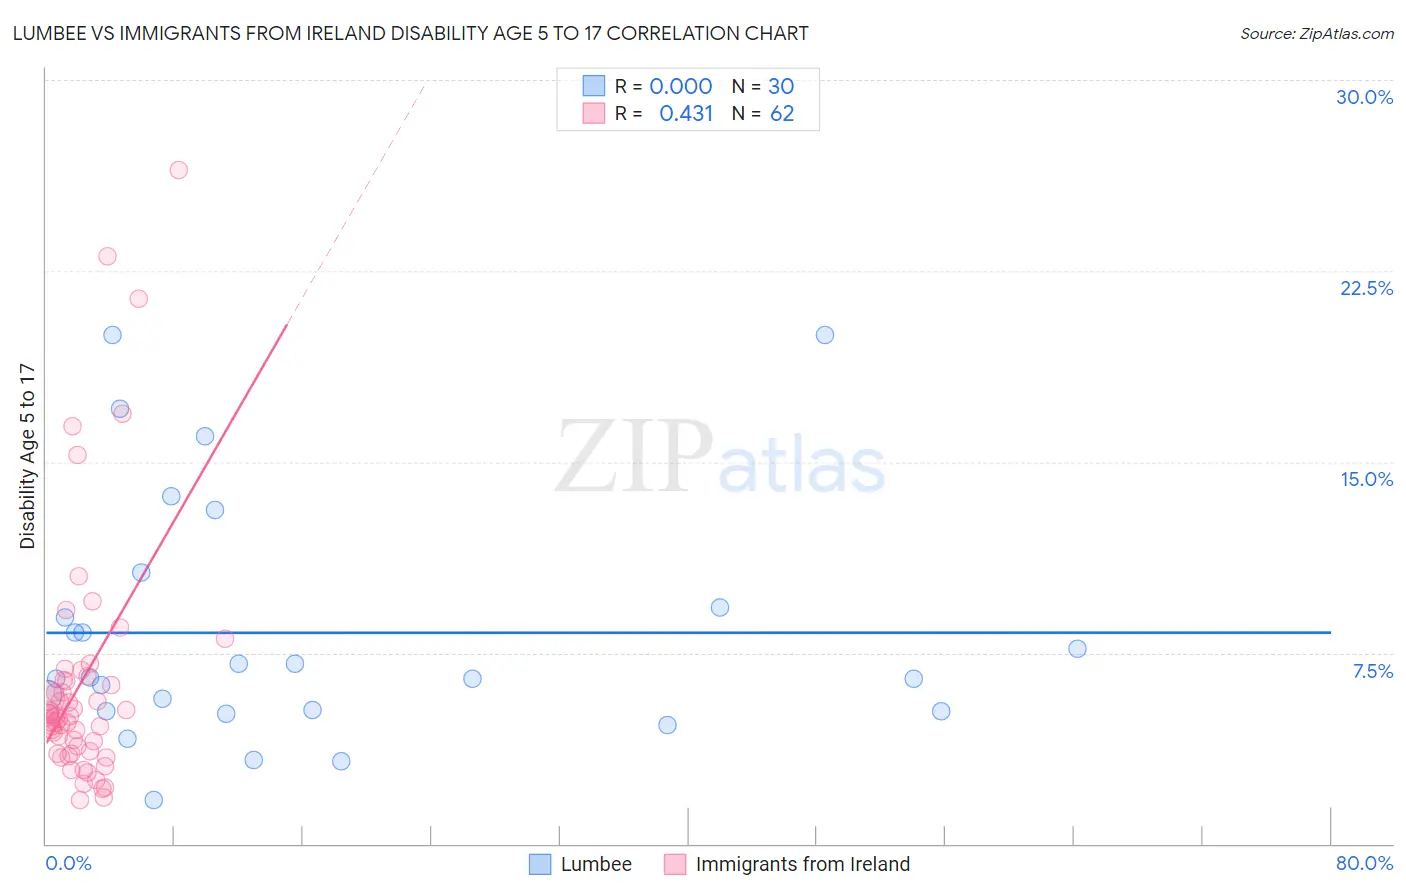
Lumbee vs Immigrants from Ireland Disability Age 5 to 17 Correlation Chart
The statistical analysis conducted on geographies consisting of 92,024,510 people shows no correlation between the proportion of Lumbee and percentage of population with a disability between the ages 5 and 17 in the United States with a correlation coefficient (R) of 0.000 and weighted average of 6.2%. Similarly, the statistical analysis conducted on geographies consisting of 239,046,676 people shows a moderate positive correlation between the proportion of Immigrants from Ireland and percentage of population with a disability between the ages 5 and 17 in the United States with a correlation coefficient (R) of 0.431 and weighted average of 5.2%, a difference of 20.8%.
Disability Age 5 to 17 Correlation Summary
| Measurement | Lumbee | Immigrants from Ireland |
| Minimum | 1.7% | 1.7% |
| Maximum | 20.0% | 26.5% |
| Range | 18.3% | 24.8% |
| Mean | 8.3% | 6.4% |
| Median | 6.5% | 5.0% |
| Interquartile 25% (IQ1) | 5.2% | 3.6% |
| Interquartile 75% (IQ3) | 9.3% | 6.4% |
| Interquartile Range (IQR) | 4.1% | 2.8% |
| Standard Deviation (Sample) | 4.8% | 5.0% |
| Standard Deviation (Population) | 4.7% | 4.9% |
Similar Demographics by Disability Age 5 to 17
Demographics Similar to Lumbee by Disability Age 5 to 17
In terms of disability age 5 to 17, the demographic groups most similar to Lumbee are Immigrants from Bahamas (6.2%, a difference of 0.070%), Welsh (6.3%, a difference of 0.15%), Spanish American (6.2%, a difference of 0.19%), Cree (6.2%, a difference of 0.22%), and Carpatho Rusyn (6.3%, a difference of 0.27%).
| Demographics | Rating | Rank | Disability Age 5 to 17 |
| Whites/Caucasians | 0.0 /100 | #291 | Tragic 6.2% |
| Immigrants | Senegal | 0.0 /100 | #292 | Tragic 6.2% |
| Central American Indians | 0.0 /100 | #293 | Tragic 6.2% |
| Irish | 0.0 /100 | #294 | Tragic 6.2% |
| Cree | 0.0 /100 | #295 | Tragic 6.2% |
| Spanish Americans | 0.0 /100 | #296 | Tragic 6.2% |
| Immigrants | Bahamas | 0.0 /100 | #297 | Tragic 6.2% |
| Lumbee | 0.0 /100 | #298 | Tragic 6.2% |
| Welsh | 0.0 /100 | #299 | Tragic 6.3% |
| Carpatho Rusyns | 0.0 /100 | #300 | Tragic 6.3% |
| U.S. Virgin Islanders | 0.0 /100 | #301 | Tragic 6.3% |
| Celtics | 0.0 /100 | #302 | Tragic 6.3% |
| Yakama | 0.0 /100 | #303 | Tragic 6.3% |
| Senegalese | 0.0 /100 | #304 | Tragic 6.3% |
| Natives/Alaskans | 0.0 /100 | #305 | Tragic 6.3% |
Demographics Similar to Immigrants from Ireland by Disability Age 5 to 17
In terms of disability age 5 to 17, the demographic groups most similar to Immigrants from Ireland are Immigrants from Switzerland (5.2%, a difference of 0.090%), Immigrants from Bangladesh (5.2%, a difference of 0.11%), Immigrants from South Eastern Asia (5.2%, a difference of 0.14%), Immigrants from Greece (5.2%, a difference of 0.15%), and Palestinian (5.2%, a difference of 0.19%).
| Demographics | Rating | Rank | Disability Age 5 to 17 |
| Laotians | 99.9 /100 | #55 | Exceptional 5.1% |
| Immigrants | Turkey | 99.9 /100 | #56 | Exceptional 5.1% |
| Immigrants | Poland | 99.9 /100 | #57 | Exceptional 5.1% |
| Immigrants | Ukraine | 99.9 /100 | #58 | Exceptional 5.1% |
| Immigrants | North Macedonia | 99.9 /100 | #59 | Exceptional 5.1% |
| Immigrants | Eastern Europe | 99.9 /100 | #60 | Exceptional 5.1% |
| Immigrants | Switzerland | 99.8 /100 | #61 | Exceptional 5.2% |
| Immigrants | Ireland | 99.8 /100 | #62 | Exceptional 5.2% |
| Immigrants | Bangladesh | 99.8 /100 | #63 | Exceptional 5.2% |
| Immigrants | South Eastern Asia | 99.8 /100 | #64 | Exceptional 5.2% |
| Immigrants | Greece | 99.8 /100 | #65 | Exceptional 5.2% |
| Palestinians | 99.8 /100 | #66 | Exceptional 5.2% |
| Macedonians | 99.8 /100 | #67 | Exceptional 5.2% |
| Immigrants | Syria | 99.7 /100 | #68 | Exceptional 5.2% |
| Guyanese | 99.7 /100 | #69 | Exceptional 5.2% |