Hungarian vs Immigrants from Ireland Disability Age 5 to 17
COMPARE
Hungarian
Immigrants from Ireland
Disability Age 5 to 17
Disability Age 5 to 17 Comparison
Hungarians
Immigrants from Ireland
5.8%
DISABILITY AGE 5 TO 17
2.6/ 100
METRIC RATING
238th/ 347
METRIC RANK
5.2%
DISABILITY AGE 5 TO 17
99.8/ 100
METRIC RATING
62nd/ 347
METRIC RANK
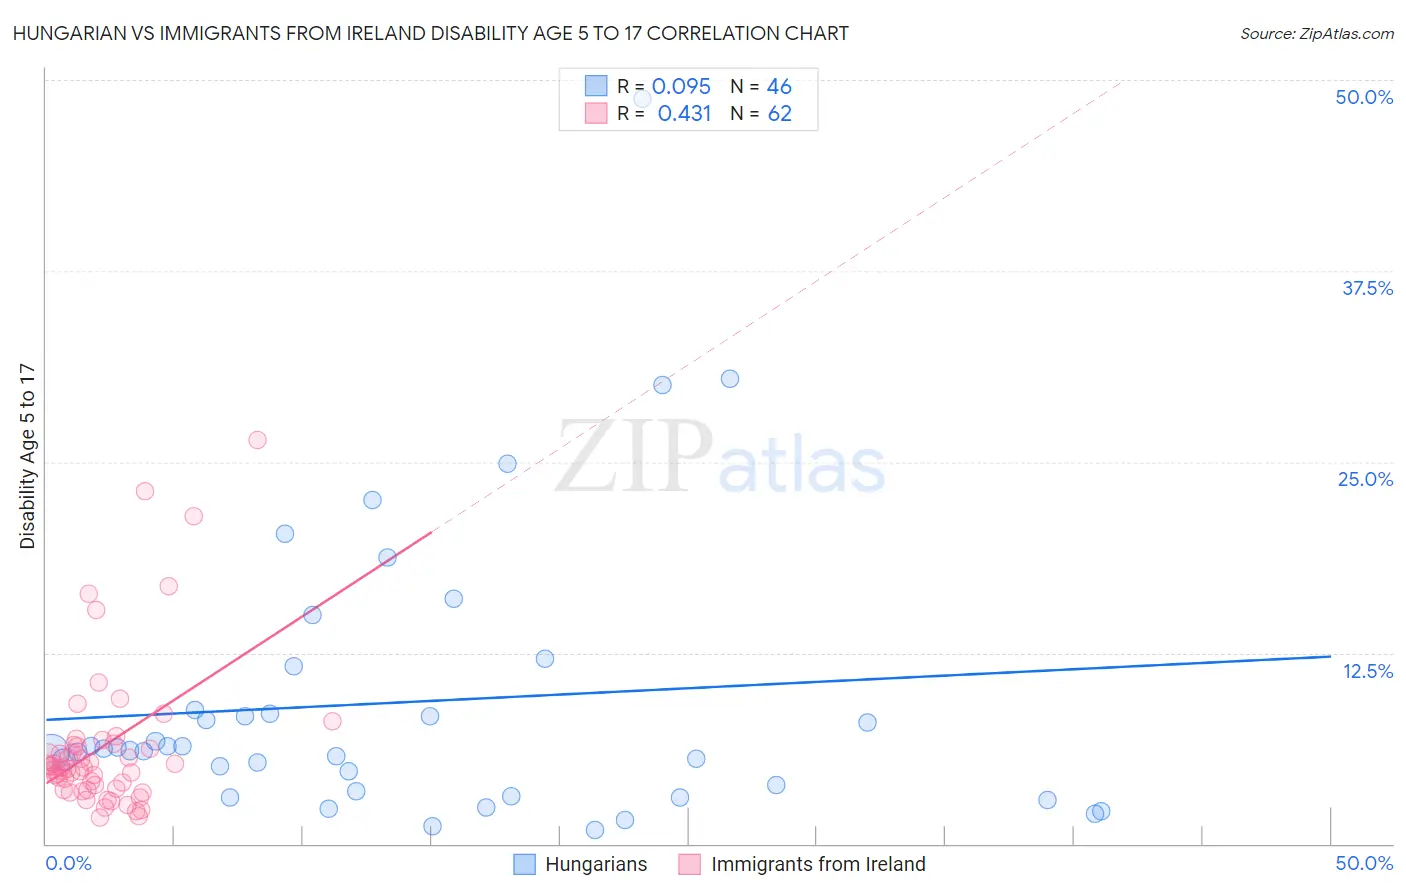
Hungarian vs Immigrants from Ireland Disability Age 5 to 17 Correlation Chart
The statistical analysis conducted on geographies consisting of 479,147,501 people shows a slight positive correlation between the proportion of Hungarians and percentage of population with a disability between the ages 5 and 17 in the United States with a correlation coefficient (R) of 0.095 and weighted average of 5.8%. Similarly, the statistical analysis conducted on geographies consisting of 239,046,676 people shows a moderate positive correlation between the proportion of Immigrants from Ireland and percentage of population with a disability between the ages 5 and 17 in the United States with a correlation coefficient (R) of 0.431 and weighted average of 5.2%, a difference of 13.2%.
Disability Age 5 to 17 Correlation Summary
| Measurement | Hungarian | Immigrants from Ireland |
| Minimum | 0.90% | 1.7% |
| Maximum | 48.8% | 26.5% |
| Range | 47.9% | 24.8% |
| Mean | 9.3% | 6.4% |
| Median | 6.2% | 5.0% |
| Interquartile 25% (IQ1) | 3.5% | 3.6% |
| Interquartile 75% (IQ3) | 8.7% | 6.4% |
| Interquartile Range (IQR) | 5.3% | 2.8% |
| Standard Deviation (Sample) | 9.4% | 5.0% |
| Standard Deviation (Population) | 9.3% | 4.9% |
Similar Demographics by Disability Age 5 to 17
Demographics Similar to Hungarians by Disability Age 5 to 17
In terms of disability age 5 to 17, the demographic groups most similar to Hungarians are Sudanese (5.8%, a difference of 0.10%), German Russian (5.9%, a difference of 0.10%), West Indian (5.9%, a difference of 0.12%), Immigrants from Brazil (5.8%, a difference of 0.25%), and Immigrants from Caribbean (5.9%, a difference of 0.26%).
| Demographics | Rating | Rank | Disability Age 5 to 17 |
| Europeans | 4.5 /100 | #231 | Tragic 5.8% |
| Immigrants | Laos | 3.8 /100 | #232 | Tragic 5.8% |
| Immigrants | West Indies | 3.5 /100 | #233 | Tragic 5.8% |
| Immigrants | Kenya | 3.4 /100 | #234 | Tragic 5.8% |
| Malaysians | 3.4 /100 | #235 | Tragic 5.8% |
| Immigrants | Brazil | 3.2 /100 | #236 | Tragic 5.8% |
| Sudanese | 2.9 /100 | #237 | Tragic 5.8% |
| Hungarians | 2.6 /100 | #238 | Tragic 5.8% |
| German Russians | 2.4 /100 | #239 | Tragic 5.9% |
| West Indians | 2.4 /100 | #240 | Tragic 5.9% |
| Immigrants | Caribbean | 2.1 /100 | #241 | Tragic 5.9% |
| Spaniards | 2.0 /100 | #242 | Tragic 5.9% |
| Indonesians | 2.0 /100 | #243 | Tragic 5.9% |
| Immigrants | Germany | 1.9 /100 | #244 | Tragic 5.9% |
| Immigrants | Micronesia | 1.9 /100 | #245 | Tragic 5.9% |
Demographics Similar to Immigrants from Ireland by Disability Age 5 to 17
In terms of disability age 5 to 17, the demographic groups most similar to Immigrants from Ireland are Immigrants from Switzerland (5.2%, a difference of 0.090%), Immigrants from Bangladesh (5.2%, a difference of 0.11%), Immigrants from South Eastern Asia (5.2%, a difference of 0.14%), Immigrants from Greece (5.2%, a difference of 0.15%), and Palestinian (5.2%, a difference of 0.19%).
| Demographics | Rating | Rank | Disability Age 5 to 17 |
| Laotians | 99.9 /100 | #55 | Exceptional 5.1% |
| Immigrants | Turkey | 99.9 /100 | #56 | Exceptional 5.1% |
| Immigrants | Poland | 99.9 /100 | #57 | Exceptional 5.1% |
| Immigrants | Ukraine | 99.9 /100 | #58 | Exceptional 5.1% |
| Immigrants | North Macedonia | 99.9 /100 | #59 | Exceptional 5.1% |
| Immigrants | Eastern Europe | 99.9 /100 | #60 | Exceptional 5.1% |
| Immigrants | Switzerland | 99.8 /100 | #61 | Exceptional 5.2% |
| Immigrants | Ireland | 99.8 /100 | #62 | Exceptional 5.2% |
| Immigrants | Bangladesh | 99.8 /100 | #63 | Exceptional 5.2% |
| Immigrants | South Eastern Asia | 99.8 /100 | #64 | Exceptional 5.2% |
| Immigrants | Greece | 99.8 /100 | #65 | Exceptional 5.2% |
| Palestinians | 99.8 /100 | #66 | Exceptional 5.2% |
| Macedonians | 99.8 /100 | #67 | Exceptional 5.2% |
| Immigrants | Syria | 99.7 /100 | #68 | Exceptional 5.2% |
| Guyanese | 99.7 /100 | #69 | Exceptional 5.2% |