Black/African American vs Immigrants from Egypt Disability Age 5 to 17
COMPARE
Black/African American
Immigrants from Egypt
Disability Age 5 to 17
Disability Age 5 to 17 Comparison
Blacks/African Americans
Immigrants from Egypt
6.8%
DISABILITY AGE 5 TO 17
0.0/ 100
METRIC RATING
333rd/ 347
METRIC RANK
5.0%
DISABILITY AGE 5 TO 17
100.0/ 100
METRIC RATING
36th/ 347
METRIC RANK
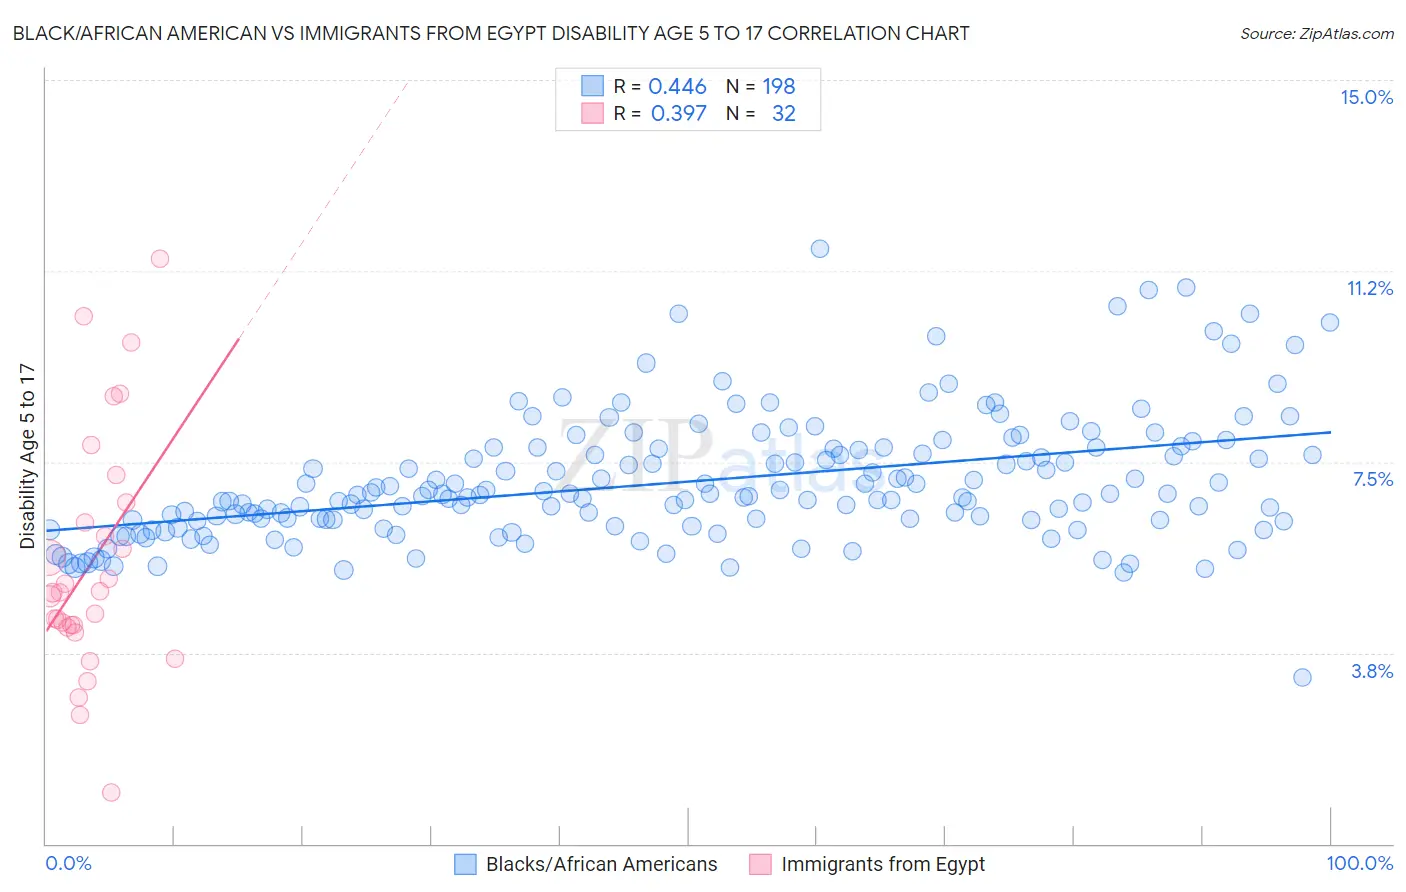
Black/African American vs Immigrants from Egypt Disability Age 5 to 17 Correlation Chart
The statistical analysis conducted on geographies consisting of 554,198,505 people shows a moderate positive correlation between the proportion of Blacks/African Americans and percentage of population with a disability between the ages 5 and 17 in the United States with a correlation coefficient (R) of 0.446 and weighted average of 6.8%. Similarly, the statistical analysis conducted on geographies consisting of 244,261,461 people shows a mild positive correlation between the proportion of Immigrants from Egypt and percentage of population with a disability between the ages 5 and 17 in the United States with a correlation coefficient (R) of 0.397 and weighted average of 5.0%, a difference of 34.9%.
Disability Age 5 to 17 Correlation Summary
| Measurement | Black/African American | Immigrants from Egypt |
| Minimum | 3.3% | 1.0% |
| Maximum | 11.7% | 11.5% |
| Range | 8.4% | 10.5% |
| Mean | 7.1% | 5.5% |
| Median | 6.8% | 4.9% |
| Interquartile 25% (IQ1) | 6.3% | 4.3% |
| Interquartile 75% (IQ3) | 7.7% | 6.5% |
| Interquartile Range (IQR) | 1.4% | 2.2% |
| Standard Deviation (Sample) | 1.2% | 2.4% |
| Standard Deviation (Population) | 1.2% | 2.3% |
Similar Demographics by Disability Age 5 to 17
Demographics Similar to Blacks/African Americans by Disability Age 5 to 17
In terms of disability age 5 to 17, the demographic groups most similar to Blacks/African Americans are Seminole (6.8%, a difference of 0.050%), Immigrants from the Azores (6.7%, a difference of 0.59%), French Canadian (6.7%, a difference of 0.61%), Dutch West Indian (6.7%, a difference of 0.69%), and Ottawa (6.8%, a difference of 0.75%).
| Demographics | Rating | Rank | Disability Age 5 to 17 |
| Potawatomi | 0.0 /100 | #326 | Tragic 6.5% |
| French American Indians | 0.0 /100 | #327 | Tragic 6.6% |
| Pennsylvania Germans | 0.0 /100 | #328 | Tragic 6.6% |
| Blackfeet | 0.0 /100 | #329 | Tragic 6.6% |
| Dutch West Indians | 0.0 /100 | #330 | Tragic 6.7% |
| French Canadians | 0.0 /100 | #331 | Tragic 6.7% |
| Immigrants | Azores | 0.0 /100 | #332 | Tragic 6.7% |
| Blacks/African Americans | 0.0 /100 | #333 | Tragic 6.8% |
| Seminole | 0.0 /100 | #334 | Tragic 6.8% |
| Ottawa | 0.0 /100 | #335 | Tragic 6.8% |
| Chickasaw | 0.0 /100 | #336 | Tragic 6.8% |
| Creek | 0.0 /100 | #337 | Tragic 6.9% |
| Iroquois | 0.0 /100 | #338 | Tragic 6.9% |
| Choctaw | 0.0 /100 | #339 | Tragic 6.9% |
| Cherokee | 0.0 /100 | #340 | Tragic 6.9% |
Demographics Similar to Immigrants from Egypt by Disability Age 5 to 17
In terms of disability age 5 to 17, the demographic groups most similar to Immigrants from Egypt are Immigrants from Belarus (5.0%, a difference of 0.030%), Bolivian (5.0%, a difference of 0.050%), Immigrants from Philippines (5.0%, a difference of 0.070%), Immigrants from Argentina (5.0%, a difference of 0.080%), and Okinawan (5.0%, a difference of 0.15%).
| Demographics | Rating | Rank | Disability Age 5 to 17 |
| Immigrants | Serbia | 100.0 /100 | #29 | Exceptional 4.9% |
| Immigrants | Malaysia | 100.0 /100 | #30 | Exceptional 5.0% |
| Immigrants | Pakistan | 100.0 /100 | #31 | Exceptional 5.0% |
| Soviet Union | 100.0 /100 | #32 | Exceptional 5.0% |
| Immigrants | Indonesia | 100.0 /100 | #33 | Exceptional 5.0% |
| Israelis | 100.0 /100 | #34 | Exceptional 5.0% |
| Bolivians | 100.0 /100 | #35 | Exceptional 5.0% |
| Immigrants | Egypt | 100.0 /100 | #36 | Exceptional 5.0% |
| Immigrants | Belarus | 100.0 /100 | #37 | Exceptional 5.0% |
| Immigrants | Philippines | 100.0 /100 | #38 | Exceptional 5.0% |
| Immigrants | Argentina | 100.0 /100 | #39 | Exceptional 5.0% |
| Okinawans | 100.0 /100 | #40 | Exceptional 5.0% |
| Immigrants | Australia | 100.0 /100 | #41 | Exceptional 5.0% |
| Immigrants | Sri Lanka | 100.0 /100 | #42 | Exceptional 5.0% |
| Immigrants | Russia | 100.0 /100 | #43 | Exceptional 5.0% |