Black/African American vs Immigrants from Ethiopia Disability Age 5 to 17
COMPARE
Black/African American
Immigrants from Ethiopia
Disability Age 5 to 17
Disability Age 5 to 17 Comparison
Blacks/African Americans
Immigrants from Ethiopia
6.8%
DISABILITY AGE 5 TO 17
0.0/ 100
METRIC RATING
333rd/ 347
METRIC RANK
5.4%
DISABILITY AGE 5 TO 17
95.5/ 100
METRIC RATING
123rd/ 347
METRIC RANK
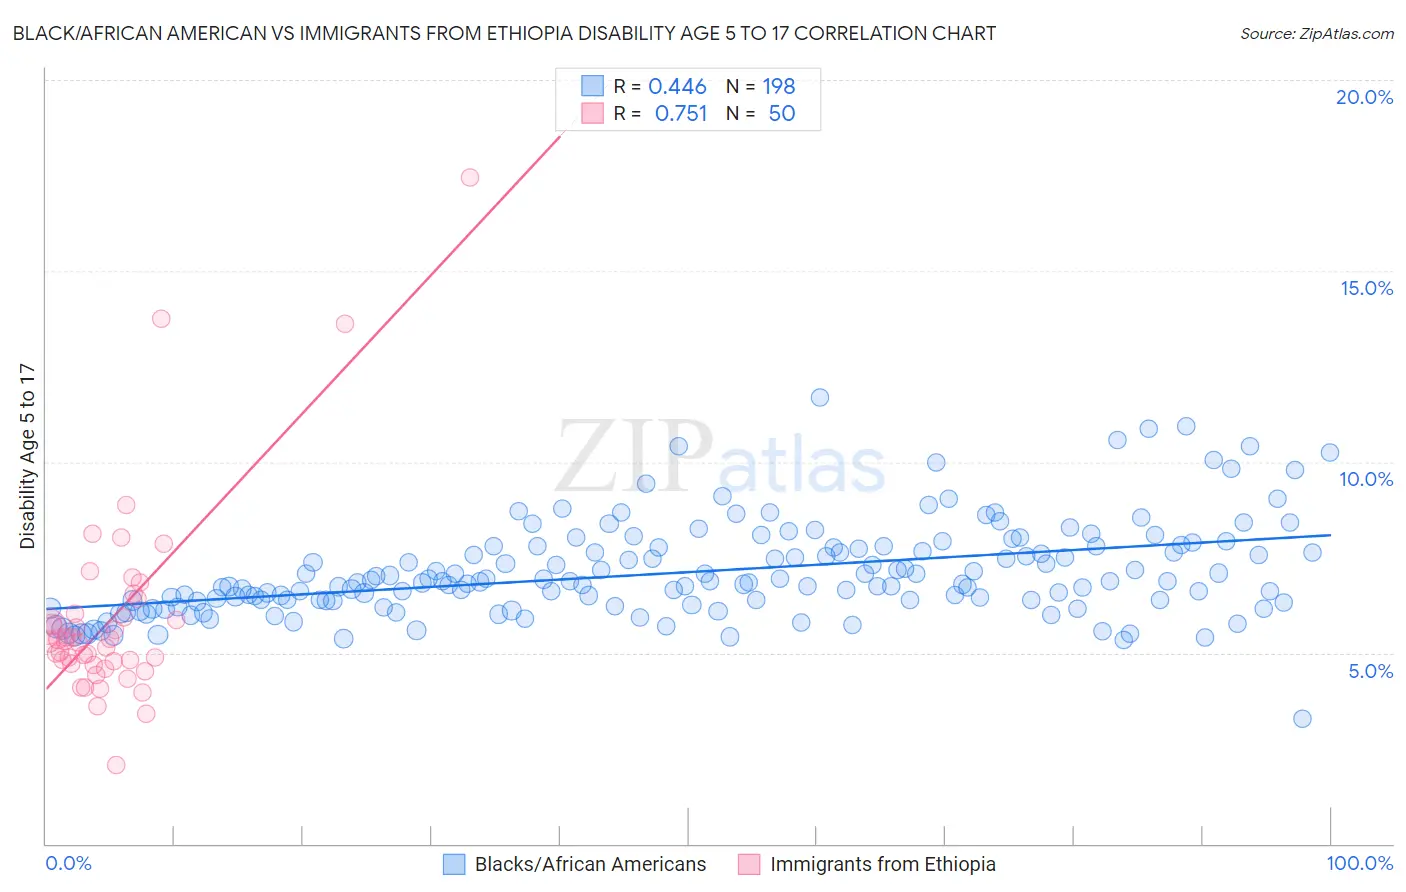
Black/African American vs Immigrants from Ethiopia Disability Age 5 to 17 Correlation Chart
The statistical analysis conducted on geographies consisting of 554,198,505 people shows a moderate positive correlation between the proportion of Blacks/African Americans and percentage of population with a disability between the ages 5 and 17 in the United States with a correlation coefficient (R) of 0.446 and weighted average of 6.8%. Similarly, the statistical analysis conducted on geographies consisting of 210,785,168 people shows a strong positive correlation between the proportion of Immigrants from Ethiopia and percentage of population with a disability between the ages 5 and 17 in the United States with a correlation coefficient (R) of 0.751 and weighted average of 5.4%, a difference of 25.4%.
Disability Age 5 to 17 Correlation Summary
| Measurement | Black/African American | Immigrants from Ethiopia |
| Minimum | 3.3% | 2.1% |
| Maximum | 11.7% | 17.5% |
| Range | 8.4% | 15.4% |
| Mean | 7.1% | 5.9% |
| Median | 6.8% | 5.3% |
| Interquartile 25% (IQ1) | 6.3% | 4.7% |
| Interquartile 75% (IQ3) | 7.7% | 6.0% |
| Interquartile Range (IQR) | 1.4% | 1.3% |
| Standard Deviation (Sample) | 1.2% | 2.6% |
| Standard Deviation (Population) | 1.2% | 2.6% |
Similar Demographics by Disability Age 5 to 17
Demographics Similar to Blacks/African Americans by Disability Age 5 to 17
In terms of disability age 5 to 17, the demographic groups most similar to Blacks/African Americans are Seminole (6.8%, a difference of 0.050%), Immigrants from the Azores (6.7%, a difference of 0.59%), French Canadian (6.7%, a difference of 0.61%), Dutch West Indian (6.7%, a difference of 0.69%), and Ottawa (6.8%, a difference of 0.75%).
| Demographics | Rating | Rank | Disability Age 5 to 17 |
| Potawatomi | 0.0 /100 | #326 | Tragic 6.5% |
| French American Indians | 0.0 /100 | #327 | Tragic 6.6% |
| Pennsylvania Germans | 0.0 /100 | #328 | Tragic 6.6% |
| Blackfeet | 0.0 /100 | #329 | Tragic 6.6% |
| Dutch West Indians | 0.0 /100 | #330 | Tragic 6.7% |
| French Canadians | 0.0 /100 | #331 | Tragic 6.7% |
| Immigrants | Azores | 0.0 /100 | #332 | Tragic 6.7% |
| Blacks/African Americans | 0.0 /100 | #333 | Tragic 6.8% |
| Seminole | 0.0 /100 | #334 | Tragic 6.8% |
| Ottawa | 0.0 /100 | #335 | Tragic 6.8% |
| Chickasaw | 0.0 /100 | #336 | Tragic 6.8% |
| Creek | 0.0 /100 | #337 | Tragic 6.9% |
| Iroquois | 0.0 /100 | #338 | Tragic 6.9% |
| Choctaw | 0.0 /100 | #339 | Tragic 6.9% |
| Cherokee | 0.0 /100 | #340 | Tragic 6.9% |
Demographics Similar to Immigrants from Ethiopia by Disability Age 5 to 17
In terms of disability age 5 to 17, the demographic groups most similar to Immigrants from Ethiopia are Chilean (5.4%, a difference of 0.10%), Crow (5.4%, a difference of 0.13%), Immigrants from Chile (5.4%, a difference of 0.15%), Maltese (5.4%, a difference of 0.16%), and New Zealander (5.4%, a difference of 0.16%).
| Demographics | Rating | Rank | Disability Age 5 to 17 |
| Cypriots | 97.7 /100 | #116 | Exceptional 5.3% |
| Immigrants | Afghanistan | 97.4 /100 | #117 | Exceptional 5.3% |
| South Americans | 97.1 /100 | #118 | Exceptional 5.4% |
| Immigrants | South America | 97.1 /100 | #119 | Exceptional 5.4% |
| Immigrants | Immigrants | 97.0 /100 | #120 | Exceptional 5.4% |
| Maltese | 96.0 /100 | #121 | Exceptional 5.4% |
| Chileans | 95.8 /100 | #122 | Exceptional 5.4% |
| Immigrants | Ethiopia | 95.5 /100 | #123 | Exceptional 5.4% |
| Crow | 95.0 /100 | #124 | Exceptional 5.4% |
| Immigrants | Chile | 95.0 /100 | #125 | Exceptional 5.4% |
| New Zealanders | 95.0 /100 | #126 | Exceptional 5.4% |
| Latvians | 95.0 /100 | #127 | Exceptional 5.4% |
| Immigrants | Venezuela | 94.5 /100 | #128 | Exceptional 5.4% |
| Romanians | 94.1 /100 | #129 | Exceptional 5.4% |
| Immigrants | Bulgaria | 94.0 /100 | #130 | Exceptional 5.4% |