Black/African American vs Immigrants from Sierra Leone Disability Age 5 to 17
COMPARE
Black/African American
Immigrants from Sierra Leone
Disability Age 5 to 17
Disability Age 5 to 17 Comparison
Blacks/African Americans
Immigrants from Sierra Leone
6.8%
DISABILITY AGE 5 TO 17
0.0/ 100
METRIC RATING
333rd/ 347
METRIC RANK
5.8%
DISABILITY AGE 5 TO 17
7.1/ 100
METRIC RATING
218th/ 347
METRIC RANK
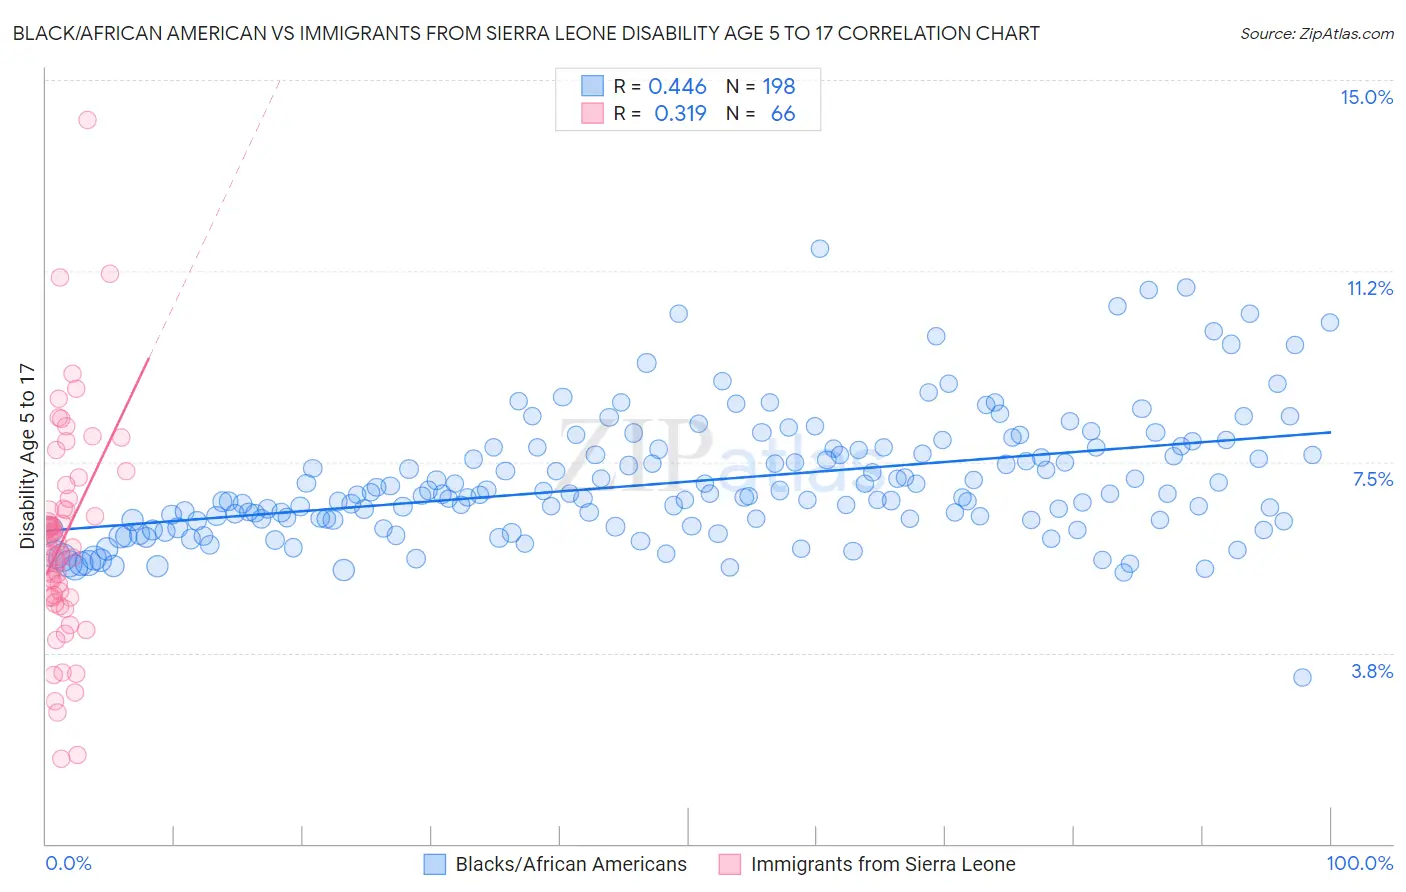
Black/African American vs Immigrants from Sierra Leone Disability Age 5 to 17 Correlation Chart
The statistical analysis conducted on geographies consisting of 554,198,505 people shows a moderate positive correlation between the proportion of Blacks/African Americans and percentage of population with a disability between the ages 5 and 17 in the United States with a correlation coefficient (R) of 0.446 and weighted average of 6.8%. Similarly, the statistical analysis conducted on geographies consisting of 101,549,663 people shows a mild positive correlation between the proportion of Immigrants from Sierra Leone and percentage of population with a disability between the ages 5 and 17 in the United States with a correlation coefficient (R) of 0.319 and weighted average of 5.8%, a difference of 16.9%.
Disability Age 5 to 17 Correlation Summary
| Measurement | Black/African American | Immigrants from Sierra Leone |
| Minimum | 3.3% | 1.7% |
| Maximum | 11.7% | 14.2% |
| Range | 8.4% | 12.5% |
| Mean | 7.1% | 6.0% |
| Median | 6.8% | 5.9% |
| Interquartile 25% (IQ1) | 6.3% | 4.8% |
| Interquartile 75% (IQ3) | 7.7% | 6.8% |
| Interquartile Range (IQR) | 1.4% | 1.9% |
| Standard Deviation (Sample) | 1.2% | 2.2% |
| Standard Deviation (Population) | 1.2% | 2.1% |
Similar Demographics by Disability Age 5 to 17
Demographics Similar to Blacks/African Americans by Disability Age 5 to 17
In terms of disability age 5 to 17, the demographic groups most similar to Blacks/African Americans are Seminole (6.8%, a difference of 0.050%), Immigrants from the Azores (6.7%, a difference of 0.59%), French Canadian (6.7%, a difference of 0.61%), Dutch West Indian (6.7%, a difference of 0.69%), and Ottawa (6.8%, a difference of 0.75%).
| Demographics | Rating | Rank | Disability Age 5 to 17 |
| Potawatomi | 0.0 /100 | #326 | Tragic 6.5% |
| French American Indians | 0.0 /100 | #327 | Tragic 6.6% |
| Pennsylvania Germans | 0.0 /100 | #328 | Tragic 6.6% |
| Blackfeet | 0.0 /100 | #329 | Tragic 6.6% |
| Dutch West Indians | 0.0 /100 | #330 | Tragic 6.7% |
| French Canadians | 0.0 /100 | #331 | Tragic 6.7% |
| Immigrants | Azores | 0.0 /100 | #332 | Tragic 6.7% |
| Blacks/African Americans | 0.0 /100 | #333 | Tragic 6.8% |
| Seminole | 0.0 /100 | #334 | Tragic 6.8% |
| Ottawa | 0.0 /100 | #335 | Tragic 6.8% |
| Chickasaw | 0.0 /100 | #336 | Tragic 6.8% |
| Creek | 0.0 /100 | #337 | Tragic 6.9% |
| Iroquois | 0.0 /100 | #338 | Tragic 6.9% |
| Choctaw | 0.0 /100 | #339 | Tragic 6.9% |
| Cherokee | 0.0 /100 | #340 | Tragic 6.9% |
Demographics Similar to Immigrants from Sierra Leone by Disability Age 5 to 17
In terms of disability age 5 to 17, the demographic groups most similar to Immigrants from Sierra Leone are Sierra Leonean (5.8%, a difference of 0.010%), Belgian (5.8%, a difference of 0.030%), Czech (5.8%, a difference of 0.050%), Lithuanian (5.8%, a difference of 0.070%), and Immigrants from Sudan (5.8%, a difference of 0.070%).
| Demographics | Rating | Rank | Disability Age 5 to 17 |
| Yugoslavians | 9.1 /100 | #211 | Tragic 5.8% |
| Immigrants | Panama | 8.7 /100 | #212 | Tragic 5.8% |
| Immigrants | Cameroon | 8.3 /100 | #213 | Tragic 5.8% |
| Immigrants | Morocco | 8.3 /100 | #214 | Tragic 5.8% |
| Swedes | 8.1 /100 | #215 | Tragic 5.8% |
| Nigerians | 7.5 /100 | #216 | Tragic 5.8% |
| Czechs | 7.4 /100 | #217 | Tragic 5.8% |
| Immigrants | Sierra Leone | 7.1 /100 | #218 | Tragic 5.8% |
| Sierra Leoneans | 7.0 /100 | #219 | Tragic 5.8% |
| Belgians | 6.9 /100 | #220 | Tragic 5.8% |
| Lithuanians | 6.7 /100 | #221 | Tragic 5.8% |
| Immigrants | Sudan | 6.7 /100 | #222 | Tragic 5.8% |
| Alsatians | 6.0 /100 | #223 | Tragic 5.8% |
| Mexicans | 5.7 /100 | #224 | Tragic 5.8% |
| Guamanians/Chamorros | 5.6 /100 | #225 | Tragic 5.8% |