Native/Alaskan vs Immigrants from Micronesia Male Disability
COMPARE
Native/Alaskan
Immigrants from Micronesia
Male Disability
Male Disability Comparison
Natives/Alaskans
Immigrants from Micronesia
14.2%
MALE DISABILITY
0.0/ 100
METRIC RATING
326th/ 347
METRIC RANK
12.9%
MALE DISABILITY
0.0/ 100
METRIC RATING
295th/ 347
METRIC RANK
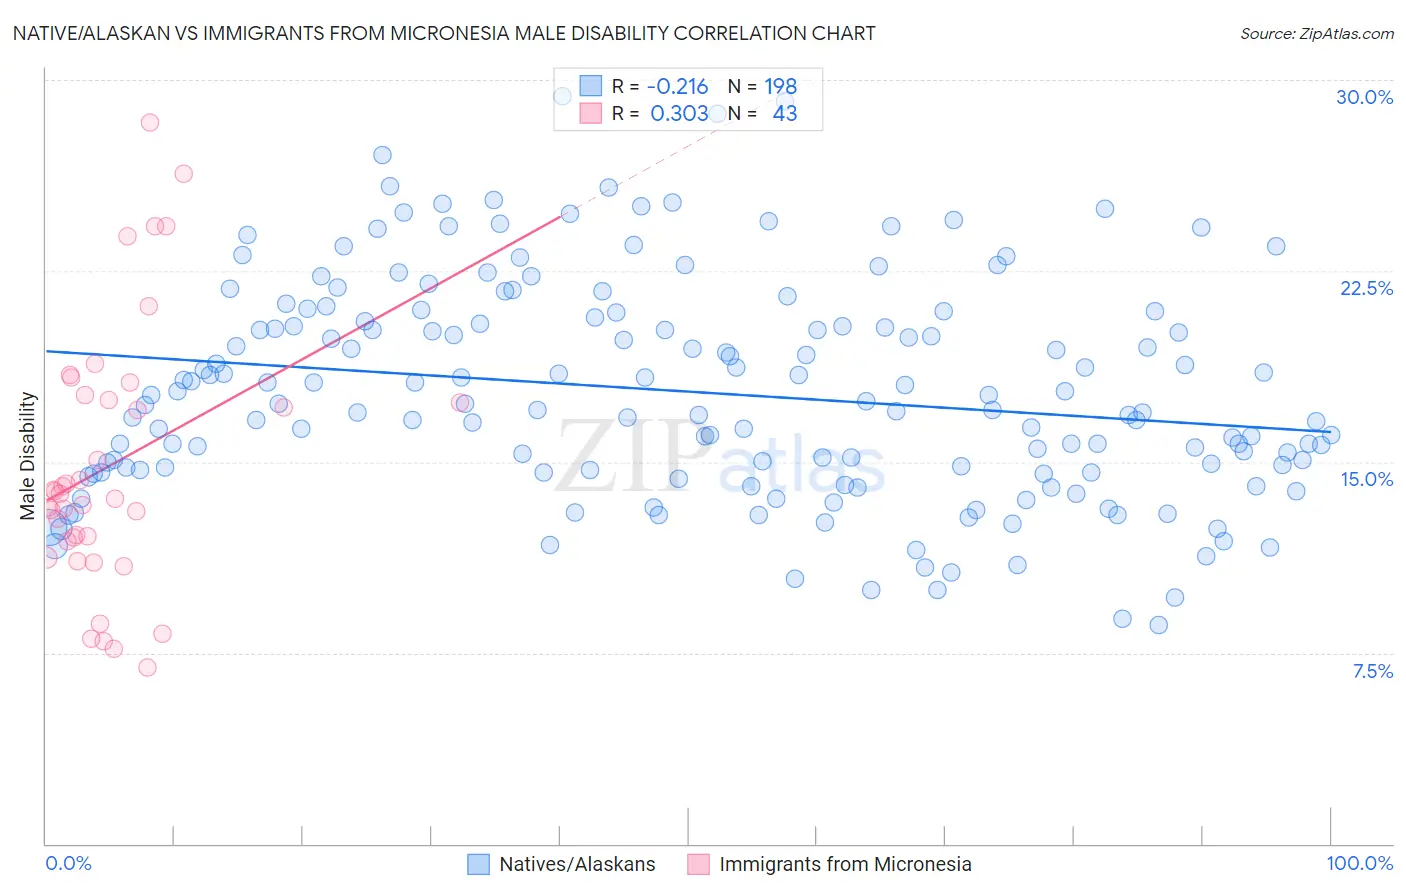
Native/Alaskan vs Immigrants from Micronesia Male Disability Correlation Chart
The statistical analysis conducted on geographies consisting of 512,854,069 people shows a weak negative correlation between the proportion of Natives/Alaskans and percentage of males with a disability in the United States with a correlation coefficient (R) of -0.216 and weighted average of 14.2%. Similarly, the statistical analysis conducted on geographies consisting of 61,603,826 people shows a mild positive correlation between the proportion of Immigrants from Micronesia and percentage of males with a disability in the United States with a correlation coefficient (R) of 0.303 and weighted average of 12.9%, a difference of 9.9%.
Male Disability Correlation Summary
| Measurement | Native/Alaskan | Immigrants from Micronesia |
| Minimum | 8.6% | 6.9% |
| Maximum | 29.4% | 28.3% |
| Range | 20.8% | 21.4% |
| Mean | 17.8% | 14.9% |
| Median | 17.3% | 13.8% |
| Interquartile 25% (IQ1) | 14.7% | 11.9% |
| Interquartile 75% (IQ3) | 20.5% | 17.6% |
| Interquartile Range (IQR) | 5.9% | 5.7% |
| Standard Deviation (Sample) | 4.3% | 5.1% |
| Standard Deviation (Population) | 4.3% | 5.0% |
Similar Demographics by Male Disability
Demographics Similar to Natives/Alaskans by Male Disability
In terms of male disability, the demographic groups most similar to Natives/Alaskans are Potawatomi (14.2%, a difference of 0.10%), Chippewa (14.3%, a difference of 0.53%), Ottawa (14.1%, a difference of 0.94%), Comanche (14.1%, a difference of 1.1%), and Cajun (14.4%, a difference of 1.1%).
| Demographics | Rating | Rank | Male Disability |
| Americans | 0.0 /100 | #319 | Tragic 13.8% |
| Tlingit-Haida | 0.0 /100 | #320 | Tragic 13.8% |
| Shoshone | 0.0 /100 | #321 | Tragic 13.8% |
| Apache | 0.0 /100 | #322 | Tragic 14.0% |
| Osage | 0.0 /100 | #323 | Tragic 14.0% |
| Comanche | 0.0 /100 | #324 | Tragic 14.1% |
| Ottawa | 0.0 /100 | #325 | Tragic 14.1% |
| Natives/Alaskans | 0.0 /100 | #326 | Tragic 14.2% |
| Potawatomi | 0.0 /100 | #327 | Tragic 14.2% |
| Chippewa | 0.0 /100 | #328 | Tragic 14.3% |
| Cajuns | 0.0 /100 | #329 | Tragic 14.4% |
| Navajo | 0.0 /100 | #330 | Tragic 14.4% |
| Tohono O'odham | 0.0 /100 | #331 | Tragic 14.6% |
| Seminole | 0.0 /100 | #332 | Tragic 14.7% |
| Yuman | 0.0 /100 | #333 | Tragic 14.7% |
Demographics Similar to Immigrants from Micronesia by Male Disability
In terms of male disability, the demographic groups most similar to Immigrants from Micronesia are Nonimmigrants (12.9%, a difference of 0.070%), Marshallese (12.9%, a difference of 0.10%), Inupiat (13.0%, a difference of 0.17%), Yaqui (12.9%, a difference of 0.33%), and Pennsylvania German (13.0%, a difference of 0.37%).
| Demographics | Rating | Rank | Male Disability |
| Yup'ik | 0.0 /100 | #288 | Tragic 12.8% |
| Immigrants | Cabo Verde | 0.0 /100 | #289 | Tragic 12.8% |
| Pima | 0.0 /100 | #290 | Tragic 12.8% |
| Whites/Caucasians | 0.0 /100 | #291 | Tragic 12.8% |
| English | 0.0 /100 | #292 | Tragic 12.8% |
| Yaqui | 0.0 /100 | #293 | Tragic 12.9% |
| Marshallese | 0.0 /100 | #294 | Tragic 12.9% |
| Immigrants | Micronesia | 0.0 /100 | #295 | Tragic 12.9% |
| Immigrants | Nonimmigrants | 0.0 /100 | #296 | Tragic 12.9% |
| Inupiat | 0.0 /100 | #297 | Tragic 13.0% |
| Pennsylvania Germans | 0.0 /100 | #298 | Tragic 13.0% |
| Celtics | 0.0 /100 | #299 | Tragic 13.0% |
| Cheyenne | 0.0 /100 | #300 | Tragic 13.0% |
| French | 0.0 /100 | #301 | Tragic 13.0% |
| Crow | 0.0 /100 | #302 | Tragic 13.1% |