Immigrants from Poland vs Immigrants from Micronesia Male Disability
COMPARE
Immigrants from Poland
Immigrants from Micronesia
Male Disability
Male Disability Comparison
Immigrants from Poland
Immigrants from Micronesia
10.6%
MALE DISABILITY
98.1/ 100
METRIC RATING
83rd/ 347
METRIC RANK
12.9%
MALE DISABILITY
0.0/ 100
METRIC RATING
295th/ 347
METRIC RANK
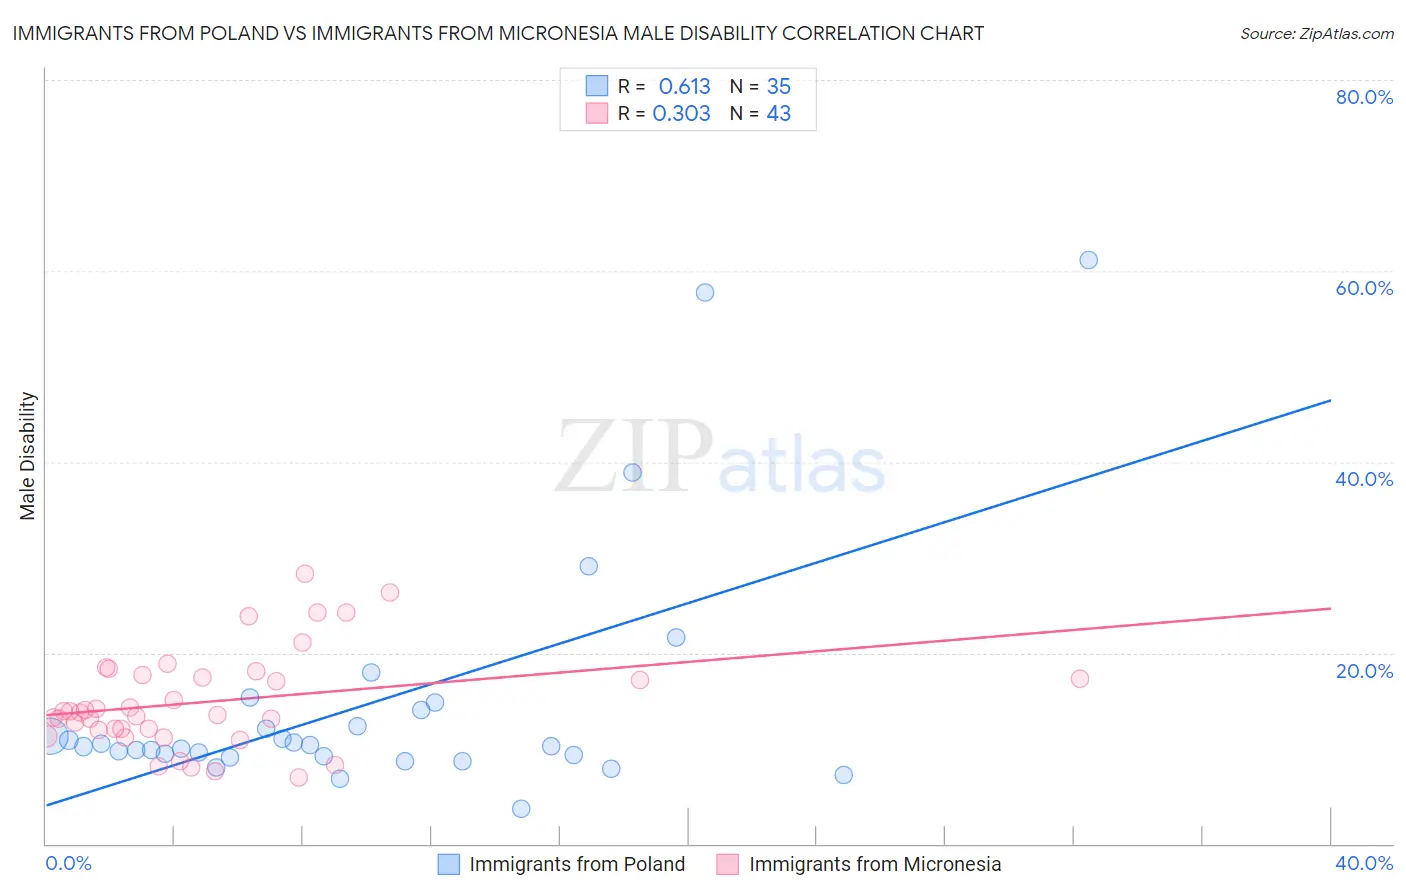
Immigrants from Poland vs Immigrants from Micronesia Male Disability Correlation Chart
The statistical analysis conducted on geographies consisting of 304,827,487 people shows a significant positive correlation between the proportion of Immigrants from Poland and percentage of males with a disability in the United States with a correlation coefficient (R) of 0.613 and weighted average of 10.6%. Similarly, the statistical analysis conducted on geographies consisting of 61,603,826 people shows a mild positive correlation between the proportion of Immigrants from Micronesia and percentage of males with a disability in the United States with a correlation coefficient (R) of 0.303 and weighted average of 12.9%, a difference of 22.0%.
Male Disability Correlation Summary
| Measurement | Immigrants from Poland | Immigrants from Micronesia |
| Minimum | 3.6% | 6.9% |
| Maximum | 61.1% | 28.3% |
| Range | 57.5% | 21.4% |
| Mean | 14.8% | 14.9% |
| Median | 10.2% | 13.8% |
| Interquartile 25% (IQ1) | 9.2% | 11.9% |
| Interquartile 75% (IQ3) | 14.0% | 17.6% |
| Interquartile Range (IQR) | 4.8% | 5.7% |
| Standard Deviation (Sample) | 12.9% | 5.1% |
| Standard Deviation (Population) | 12.7% | 5.0% |
Similar Demographics by Male Disability
Demographics Similar to Immigrants from Poland by Male Disability
In terms of male disability, the demographic groups most similar to Immigrants from Poland are Bulgarian (10.6%, a difference of 0.010%), Immigrants from Guyana (10.6%, a difference of 0.060%), Immigrants from Chile (10.6%, a difference of 0.13%), Immigrants from Jordan (10.6%, a difference of 0.19%), and Sri Lankan (10.6%, a difference of 0.19%).
| Demographics | Rating | Rank | Male Disability |
| Immigrants | Sierra Leone | 98.7 /100 | #76 | Exceptional 10.5% |
| Laotians | 98.6 /100 | #77 | Exceptional 10.6% |
| Immigrants | Russia | 98.6 /100 | #78 | Exceptional 10.6% |
| Zimbabweans | 98.4 /100 | #79 | Exceptional 10.6% |
| Immigrants | Jordan | 98.4 /100 | #80 | Exceptional 10.6% |
| Immigrants | Chile | 98.3 /100 | #81 | Exceptional 10.6% |
| Immigrants | Guyana | 98.2 /100 | #82 | Exceptional 10.6% |
| Immigrants | Poland | 98.1 /100 | #83 | Exceptional 10.6% |
| Bulgarians | 98.1 /100 | #84 | Exceptional 10.6% |
| Sri Lankans | 97.9 /100 | #85 | Exceptional 10.6% |
| Immigrants | Ireland | 97.9 /100 | #86 | Exceptional 10.6% |
| Immigrants | Vietnam | 97.9 /100 | #87 | Exceptional 10.6% |
| Immigrants | Western Asia | 97.8 /100 | #88 | Exceptional 10.6% |
| Immigrants | Nicaragua | 97.8 /100 | #89 | Exceptional 10.6% |
| Immigrants | Morocco | 97.7 /100 | #90 | Exceptional 10.6% |
Demographics Similar to Immigrants from Micronesia by Male Disability
In terms of male disability, the demographic groups most similar to Immigrants from Micronesia are Nonimmigrants (12.9%, a difference of 0.070%), Marshallese (12.9%, a difference of 0.10%), Inupiat (13.0%, a difference of 0.17%), Yaqui (12.9%, a difference of 0.33%), and Pennsylvania German (13.0%, a difference of 0.37%).
| Demographics | Rating | Rank | Male Disability |
| Yup'ik | 0.0 /100 | #288 | Tragic 12.8% |
| Immigrants | Cabo Verde | 0.0 /100 | #289 | Tragic 12.8% |
| Pima | 0.0 /100 | #290 | Tragic 12.8% |
| Whites/Caucasians | 0.0 /100 | #291 | Tragic 12.8% |
| English | 0.0 /100 | #292 | Tragic 12.8% |
| Yaqui | 0.0 /100 | #293 | Tragic 12.9% |
| Marshallese | 0.0 /100 | #294 | Tragic 12.9% |
| Immigrants | Micronesia | 0.0 /100 | #295 | Tragic 12.9% |
| Immigrants | Nonimmigrants | 0.0 /100 | #296 | Tragic 12.9% |
| Inupiat | 0.0 /100 | #297 | Tragic 13.0% |
| Pennsylvania Germans | 0.0 /100 | #298 | Tragic 13.0% |
| Celtics | 0.0 /100 | #299 | Tragic 13.0% |
| Cheyenne | 0.0 /100 | #300 | Tragic 13.0% |
| French | 0.0 /100 | #301 | Tragic 13.0% |
| Crow | 0.0 /100 | #302 | Tragic 13.1% |