Alaska Native vs Immigrants from Micronesia Unemployment Among Ages 25 to 29 years
COMPARE
Alaska Native
Immigrants from Micronesia
Unemployment Among Ages 25 to 29 years
Unemployment Among Ages 25 to 29 years Comparison
Alaska Natives
Immigrants from Micronesia
10.2%
UNEMPLOYMENT AMONG AGES 25 TO 29 YEARS
0.0/ 100
METRIC RATING
331st/ 347
METRIC RANK
6.6%
UNEMPLOYMENT AMONG AGES 25 TO 29 YEARS
71.5/ 100
METRIC RATING
144th/ 347
METRIC RANK
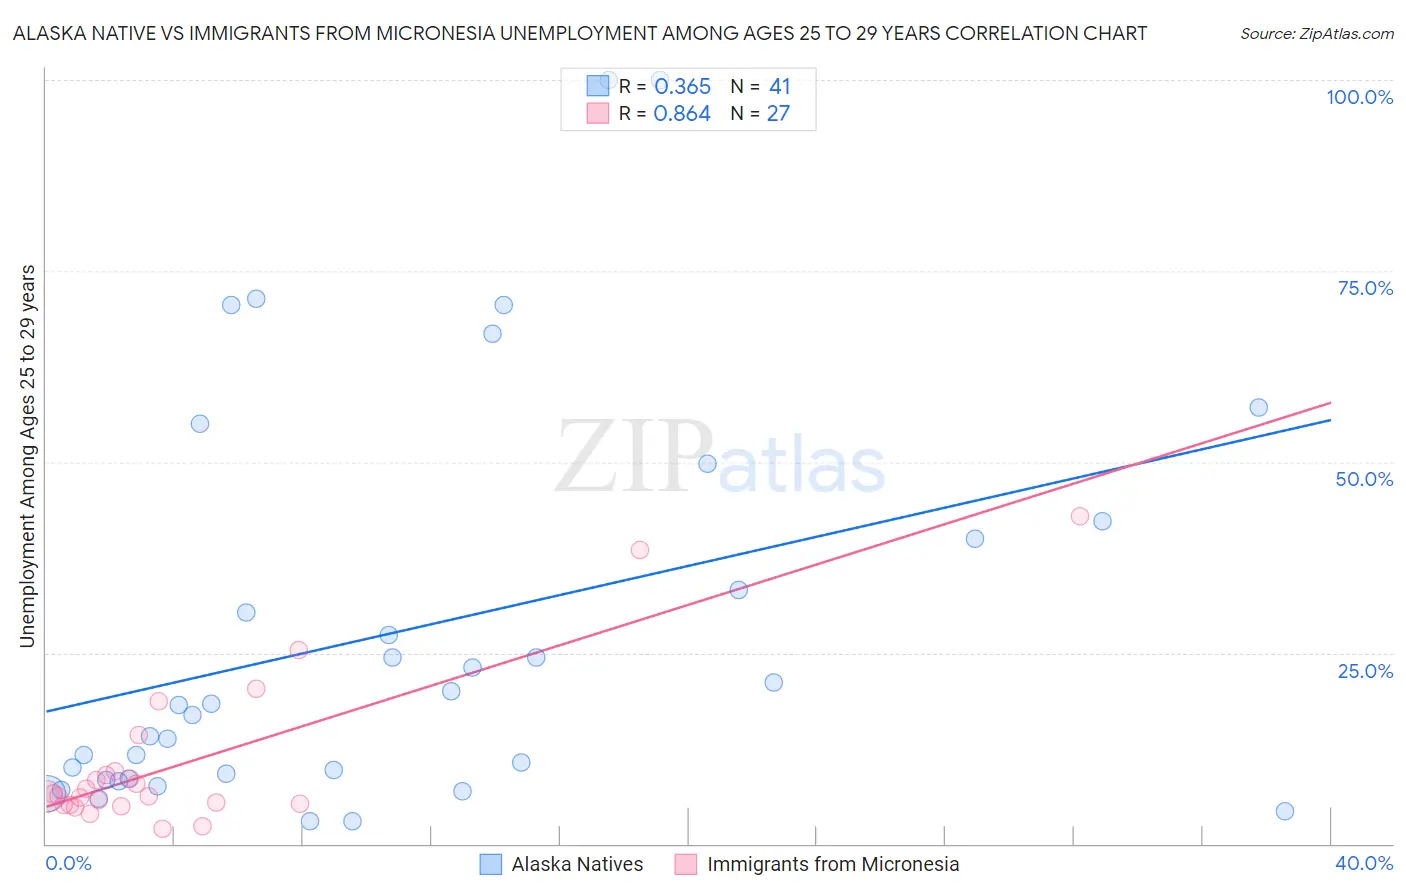
Alaska Native vs Immigrants from Micronesia Unemployment Among Ages 25 to 29 years Correlation Chart
The statistical analysis conducted on geographies consisting of 75,796,081 people shows a mild positive correlation between the proportion of Alaska Natives and unemployment rate among population between the ages 25 and 29 in the United States with a correlation coefficient (R) of 0.365 and weighted average of 10.2%. Similarly, the statistical analysis conducted on geographies consisting of 61,003,486 people shows a very strong positive correlation between the proportion of Immigrants from Micronesia and unemployment rate among population between the ages 25 and 29 in the United States with a correlation coefficient (R) of 0.864 and weighted average of 6.6%, a difference of 55.6%.
Unemployment Among Ages 25 to 29 years Correlation Summary
| Measurement | Alaska Native | Immigrants from Micronesia |
| Minimum | 2.9% | 2.0% |
| Maximum | 100.0% | 42.9% |
| Range | 97.1% | 40.9% |
| Mean | 27.8% | 10.6% |
| Median | 18.1% | 6.3% |
| Interquartile 25% (IQ1) | 8.4% | 5.2% |
| Interquartile 75% (IQ3) | 41.1% | 9.6% |
| Interquartile Range (IQR) | 32.7% | 4.4% |
| Standard Deviation (Sample) | 26.4% | 10.2% |
| Standard Deviation (Population) | 26.0% | 10.1% |
Similar Demographics by Unemployment Among Ages 25 to 29 years
Demographics Similar to Alaska Natives by Unemployment Among Ages 25 to 29 years
In terms of unemployment among ages 25 to 29 years, the demographic groups most similar to Alaska Natives are Pueblo (10.4%, a difference of 2.3%), Native/Alaskan (9.8%, a difference of 3.7%), Aleut (9.7%, a difference of 5.2%), Alaskan Athabascan (10.8%, a difference of 5.8%), and Apache (9.5%, a difference of 7.5%).
| Demographics | Rating | Rank | Unemployment Among Ages 25 to 29 years |
| Houma | 0.0 /100 | #324 | Tragic 8.7% |
| Yakama | 0.0 /100 | #325 | Tragic 8.8% |
| Shoshone | 0.0 /100 | #326 | Tragic 9.2% |
| Colville | 0.0 /100 | #327 | Tragic 9.2% |
| Apache | 0.0 /100 | #328 | Tragic 9.5% |
| Aleuts | 0.0 /100 | #329 | Tragic 9.7% |
| Natives/Alaskans | 0.0 /100 | #330 | Tragic 9.8% |
| Alaska Natives | 0.0 /100 | #331 | Tragic 10.2% |
| Pueblo | 0.0 /100 | #332 | Tragic 10.4% |
| Alaskan Athabascans | 0.0 /100 | #333 | Tragic 10.8% |
| Yuman | 0.0 /100 | #334 | Tragic 11.0% |
| Puerto Ricans | 0.0 /100 | #335 | Tragic 11.1% |
| Lumbee | 0.0 /100 | #336 | Tragic 11.2% |
| Menominee | 0.0 /100 | #337 | Tragic 11.3% |
| Sioux | 0.0 /100 | #338 | Tragic 11.7% |
Demographics Similar to Immigrants from Micronesia by Unemployment Among Ages 25 to 29 years
In terms of unemployment among ages 25 to 29 years, the demographic groups most similar to Immigrants from Micronesia are Lithuanian (6.5%, a difference of 0.050%), Slavic (6.5%, a difference of 0.080%), Nicaraguan (6.6%, a difference of 0.10%), Maltese (6.5%, a difference of 0.11%), and Romanian (6.6%, a difference of 0.16%).
| Demographics | Rating | Rank | Unemployment Among Ages 25 to 29 years |
| Eastern Europeans | 74.1 /100 | #137 | Good 6.5% |
| Immigrants | Belgium | 73.8 /100 | #138 | Good 6.5% |
| Austrians | 73.8 /100 | #139 | Good 6.5% |
| Immigrants | Pakistan | 73.8 /100 | #140 | Good 6.5% |
| Maltese | 72.9 /100 | #141 | Good 6.5% |
| Slavs | 72.5 /100 | #142 | Good 6.5% |
| Lithuanians | 72.2 /100 | #143 | Good 6.5% |
| Immigrants | Micronesia | 71.5 /100 | #144 | Good 6.6% |
| Nicaraguans | 70.2 /100 | #145 | Good 6.6% |
| Romanians | 69.5 /100 | #146 | Good 6.6% |
| Immigrants | Thailand | 68.4 /100 | #147 | Good 6.6% |
| Peruvians | 68.1 /100 | #148 | Good 6.6% |
| Malaysians | 67.1 /100 | #149 | Good 6.6% |
| Finns | 66.9 /100 | #150 | Good 6.6% |
| Ukrainians | 65.5 /100 | #151 | Good 6.6% |