Panamanian vs Immigrants from Micronesia Male Disability
COMPARE
Panamanian
Immigrants from Micronesia
Male Disability
Male Disability Comparison
Panamanians
Immigrants from Micronesia
11.7%
MALE DISABILITY
3.8/ 100
METRIC RATING
219th/ 347
METRIC RANK
12.9%
MALE DISABILITY
0.0/ 100
METRIC RATING
295th/ 347
METRIC RANK
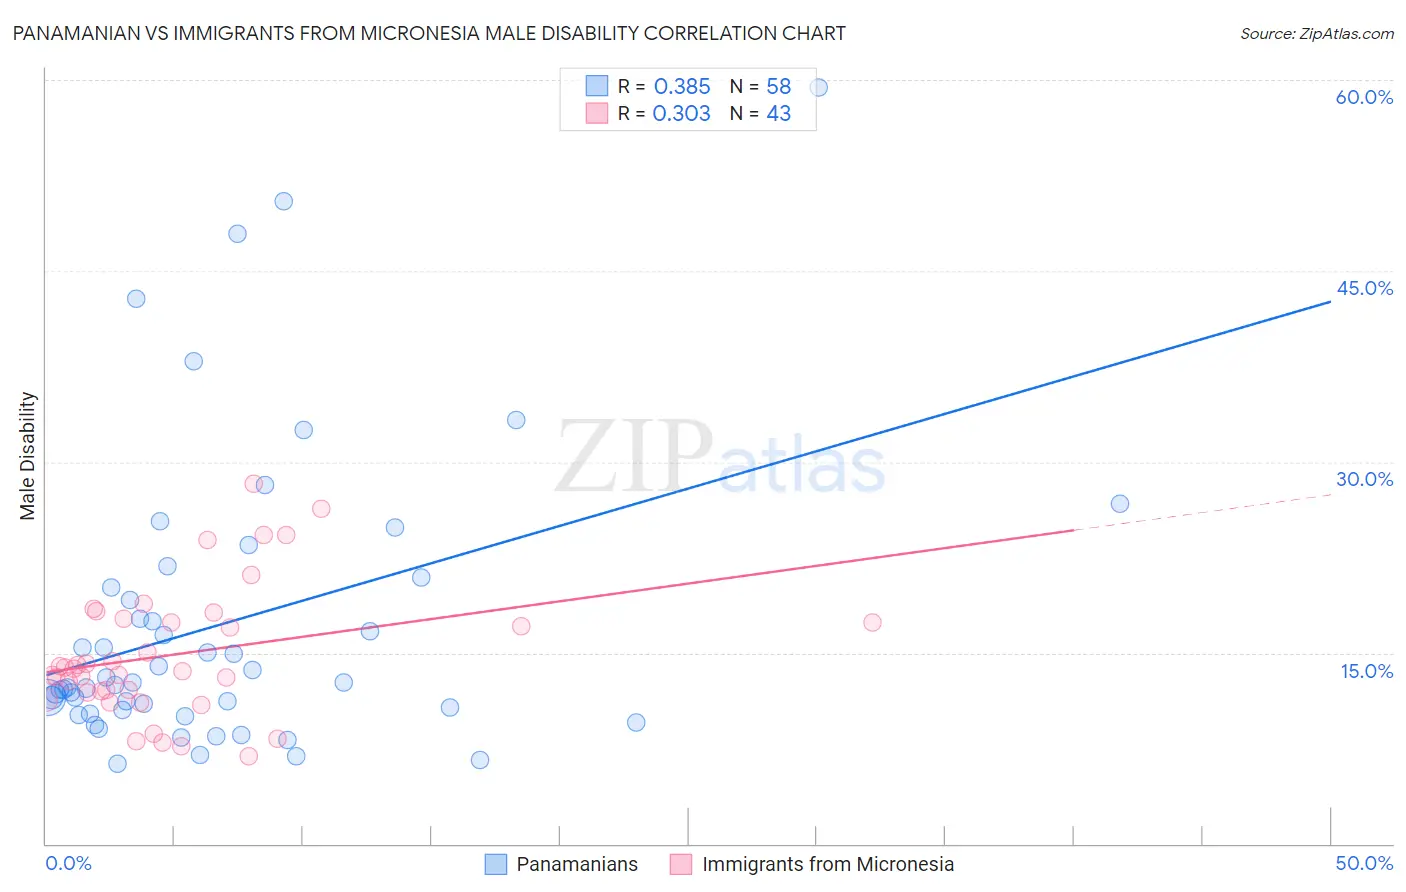
Panamanian vs Immigrants from Micronesia Male Disability Correlation Chart
The statistical analysis conducted on geographies consisting of 281,191,975 people shows a mild positive correlation between the proportion of Panamanians and percentage of males with a disability in the United States with a correlation coefficient (R) of 0.385 and weighted average of 11.7%. Similarly, the statistical analysis conducted on geographies consisting of 61,603,826 people shows a mild positive correlation between the proportion of Immigrants from Micronesia and percentage of males with a disability in the United States with a correlation coefficient (R) of 0.303 and weighted average of 12.9%, a difference of 10.3%.
Male Disability Correlation Summary
| Measurement | Panamanian | Immigrants from Micronesia |
| Minimum | 6.3% | 6.9% |
| Maximum | 59.5% | 28.3% |
| Range | 53.2% | 21.4% |
| Mean | 17.3% | 14.9% |
| Median | 12.6% | 13.8% |
| Interquartile 25% (IQ1) | 10.5% | 11.9% |
| Interquartile 75% (IQ3) | 20.1% | 17.6% |
| Interquartile Range (IQR) | 9.6% | 5.7% |
| Standard Deviation (Sample) | 11.5% | 5.1% |
| Standard Deviation (Population) | 11.4% | 5.0% |
Similar Demographics by Male Disability
Demographics Similar to Panamanians by Male Disability
In terms of male disability, the demographic groups most similar to Panamanians are Immigrants from Western Europe (11.7%, a difference of 0.010%), Immigrants from Congo (11.7%, a difference of 0.020%), Immigrants from England (11.7%, a difference of 0.060%), Alsatian (11.7%, a difference of 0.17%), and Immigrants from Bahamas (11.7%, a difference of 0.26%).
| Demographics | Rating | Rank | Male Disability |
| Immigrants | Scotland | 8.2 /100 | #212 | Tragic 11.6% |
| Mexican American Indians | 7.8 /100 | #213 | Tragic 11.6% |
| Lithuanians | 6.6 /100 | #214 | Tragic 11.6% |
| Indonesians | 5.9 /100 | #215 | Tragic 11.6% |
| Immigrants | Dominican Republic | 4.9 /100 | #216 | Tragic 11.7% |
| Immigrants | Dominica | 4.6 /100 | #217 | Tragic 11.7% |
| Immigrants | England | 4.0 /100 | #218 | Tragic 11.7% |
| Panamanians | 3.8 /100 | #219 | Tragic 11.7% |
| Immigrants | Western Europe | 3.8 /100 | #220 | Tragic 11.7% |
| Immigrants | Congo | 3.7 /100 | #221 | Tragic 11.7% |
| Alsatians | 3.3 /100 | #222 | Tragic 11.7% |
| Immigrants | Bahamas | 3.2 /100 | #223 | Tragic 11.7% |
| Japanese | 3.1 /100 | #224 | Tragic 11.7% |
| Liberians | 3.1 /100 | #225 | Tragic 11.8% |
| Sub-Saharan Africans | 2.8 /100 | #226 | Tragic 11.8% |
Demographics Similar to Immigrants from Micronesia by Male Disability
In terms of male disability, the demographic groups most similar to Immigrants from Micronesia are Nonimmigrants (12.9%, a difference of 0.070%), Marshallese (12.9%, a difference of 0.10%), Inupiat (13.0%, a difference of 0.17%), Yaqui (12.9%, a difference of 0.33%), and Pennsylvania German (13.0%, a difference of 0.37%).
| Demographics | Rating | Rank | Male Disability |
| Yup'ik | 0.0 /100 | #288 | Tragic 12.8% |
| Immigrants | Cabo Verde | 0.0 /100 | #289 | Tragic 12.8% |
| Pima | 0.0 /100 | #290 | Tragic 12.8% |
| Whites/Caucasians | 0.0 /100 | #291 | Tragic 12.8% |
| English | 0.0 /100 | #292 | Tragic 12.8% |
| Yaqui | 0.0 /100 | #293 | Tragic 12.9% |
| Marshallese | 0.0 /100 | #294 | Tragic 12.9% |
| Immigrants | Micronesia | 0.0 /100 | #295 | Tragic 12.9% |
| Immigrants | Nonimmigrants | 0.0 /100 | #296 | Tragic 12.9% |
| Inupiat | 0.0 /100 | #297 | Tragic 13.0% |
| Pennsylvania Germans | 0.0 /100 | #298 | Tragic 13.0% |
| Celtics | 0.0 /100 | #299 | Tragic 13.0% |
| Cheyenne | 0.0 /100 | #300 | Tragic 13.0% |
| French | 0.0 /100 | #301 | Tragic 13.0% |
| Crow | 0.0 /100 | #302 | Tragic 13.1% |