Peruvian vs Immigrants from Micronesia Male Disability
COMPARE
Peruvian
Immigrants from Micronesia
Male Disability
Male Disability Comparison
Peruvians
Immigrants from Micronesia
10.4%
MALE DISABILITY
99.6/ 100
METRIC RATING
54th/ 347
METRIC RANK
12.9%
MALE DISABILITY
0.0/ 100
METRIC RATING
295th/ 347
METRIC RANK
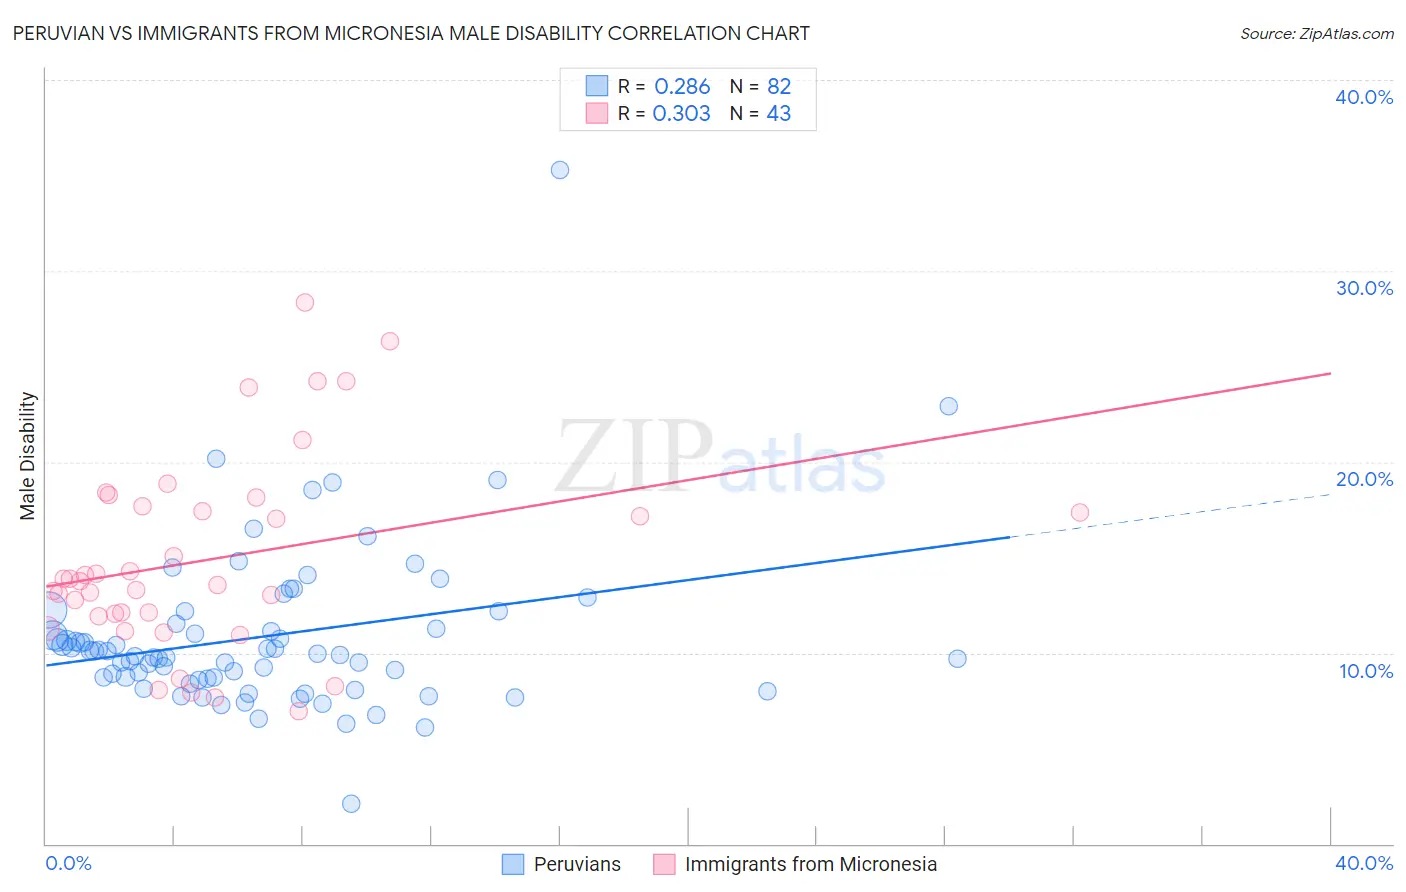
Peruvian vs Immigrants from Micronesia Male Disability Correlation Chart
The statistical analysis conducted on geographies consisting of 363,183,994 people shows a weak positive correlation between the proportion of Peruvians and percentage of males with a disability in the United States with a correlation coefficient (R) of 0.286 and weighted average of 10.4%. Similarly, the statistical analysis conducted on geographies consisting of 61,603,826 people shows a mild positive correlation between the proportion of Immigrants from Micronesia and percentage of males with a disability in the United States with a correlation coefficient (R) of 0.303 and weighted average of 12.9%, a difference of 24.7%.
Male Disability Correlation Summary
| Measurement | Peruvian | Immigrants from Micronesia |
| Minimum | 2.1% | 6.9% |
| Maximum | 35.3% | 28.3% |
| Range | 33.1% | 21.4% |
| Mean | 10.9% | 14.9% |
| Median | 9.9% | 13.8% |
| Interquartile 25% (IQ1) | 8.7% | 11.9% |
| Interquartile 75% (IQ3) | 11.5% | 17.6% |
| Interquartile Range (IQR) | 2.9% | 5.7% |
| Standard Deviation (Sample) | 4.3% | 5.1% |
| Standard Deviation (Population) | 4.3% | 5.0% |
Similar Demographics by Male Disability
Demographics Similar to Peruvians by Male Disability
In terms of male disability, the demographic groups most similar to Peruvians are Immigrants from Eritrea (10.4%, a difference of 0.020%), Immigrants from Uzbekistan (10.4%, a difference of 0.040%), Immigrants from Saudi Arabia (10.4%, a difference of 0.060%), Tongan (10.4%, a difference of 0.060%), and Salvadoran (10.4%, a difference of 0.080%).
| Demographics | Rating | Rank | Male Disability |
| Immigrants | Peru | 99.7 /100 | #47 | Exceptional 10.3% |
| Israelis | 99.7 /100 | #48 | Exceptional 10.3% |
| Immigrants | Spain | 99.7 /100 | #49 | Exceptional 10.3% |
| South Americans | 99.6 /100 | #50 | Exceptional 10.3% |
| Salvadorans | 99.6 /100 | #51 | Exceptional 10.4% |
| Immigrants | Saudi Arabia | 99.6 /100 | #52 | Exceptional 10.4% |
| Immigrants | Uzbekistan | 99.6 /100 | #53 | Exceptional 10.4% |
| Peruvians | 99.6 /100 | #54 | Exceptional 10.4% |
| Immigrants | Eritrea | 99.6 /100 | #55 | Exceptional 10.4% |
| Tongans | 99.6 /100 | #56 | Exceptional 10.4% |
| Immigrants | South America | 99.6 /100 | #57 | Exceptional 10.4% |
| Immigrants | Japan | 99.5 /100 | #58 | Exceptional 10.4% |
| Immigrants | Australia | 99.5 /100 | #59 | Exceptional 10.4% |
| Immigrants | Colombia | 99.5 /100 | #60 | Exceptional 10.4% |
| Immigrants | Northern Africa | 99.4 /100 | #61 | Exceptional 10.4% |
Demographics Similar to Immigrants from Micronesia by Male Disability
In terms of male disability, the demographic groups most similar to Immigrants from Micronesia are Nonimmigrants (12.9%, a difference of 0.070%), Marshallese (12.9%, a difference of 0.10%), Inupiat (13.0%, a difference of 0.17%), Yaqui (12.9%, a difference of 0.33%), and Pennsylvania German (13.0%, a difference of 0.37%).
| Demographics | Rating | Rank | Male Disability |
| Yup'ik | 0.0 /100 | #288 | Tragic 12.8% |
| Immigrants | Cabo Verde | 0.0 /100 | #289 | Tragic 12.8% |
| Pima | 0.0 /100 | #290 | Tragic 12.8% |
| Whites/Caucasians | 0.0 /100 | #291 | Tragic 12.8% |
| English | 0.0 /100 | #292 | Tragic 12.8% |
| Yaqui | 0.0 /100 | #293 | Tragic 12.9% |
| Marshallese | 0.0 /100 | #294 | Tragic 12.9% |
| Immigrants | Micronesia | 0.0 /100 | #295 | Tragic 12.9% |
| Immigrants | Nonimmigrants | 0.0 /100 | #296 | Tragic 12.9% |
| Inupiat | 0.0 /100 | #297 | Tragic 13.0% |
| Pennsylvania Germans | 0.0 /100 | #298 | Tragic 13.0% |
| Celtics | 0.0 /100 | #299 | Tragic 13.0% |
| Cheyenne | 0.0 /100 | #300 | Tragic 13.0% |
| French | 0.0 /100 | #301 | Tragic 13.0% |
| Crow | 0.0 /100 | #302 | Tragic 13.1% |