Guyanese vs Immigrants from Micronesia Male Disability
COMPARE
Guyanese
Immigrants from Micronesia
Male Disability
Male Disability Comparison
Guyanese
Immigrants from Micronesia
10.5%
MALE DISABILITY
99.2/ 100
METRIC RATING
66th/ 347
METRIC RANK
12.9%
MALE DISABILITY
0.0/ 100
METRIC RATING
295th/ 347
METRIC RANK
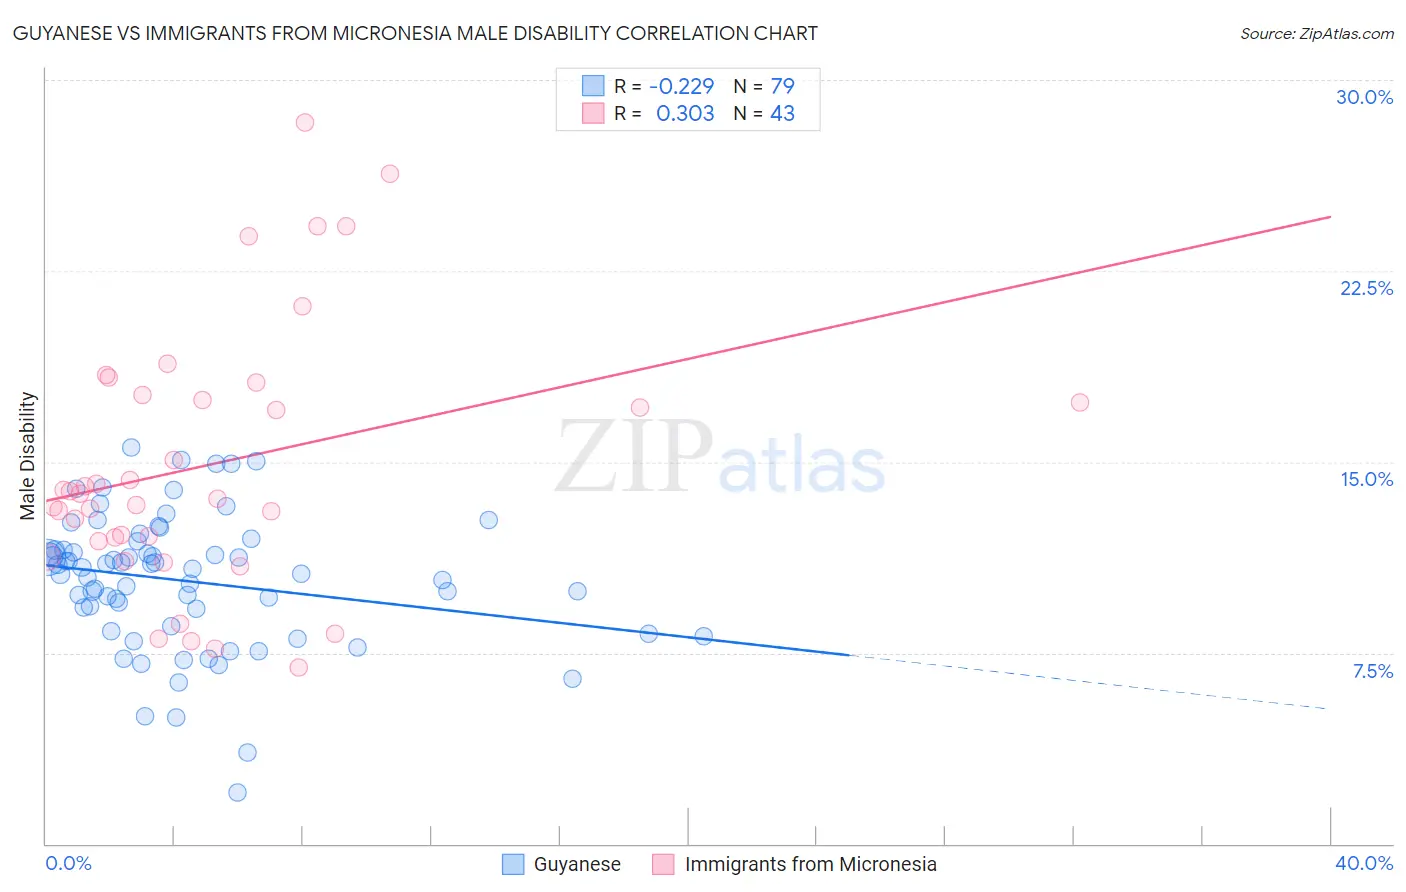
Guyanese vs Immigrants from Micronesia Male Disability Correlation Chart
The statistical analysis conducted on geographies consisting of 176,893,996 people shows a weak negative correlation between the proportion of Guyanese and percentage of males with a disability in the United States with a correlation coefficient (R) of -0.229 and weighted average of 10.5%. Similarly, the statistical analysis conducted on geographies consisting of 61,603,826 people shows a mild positive correlation between the proportion of Immigrants from Micronesia and percentage of males with a disability in the United States with a correlation coefficient (R) of 0.303 and weighted average of 12.9%, a difference of 23.6%.
Male Disability Correlation Summary
| Measurement | Guyanese | Immigrants from Micronesia |
| Minimum | 2.0% | 6.9% |
| Maximum | 15.6% | 28.3% |
| Range | 13.6% | 21.4% |
| Mean | 10.3% | 14.9% |
| Median | 10.8% | 13.8% |
| Interquartile 25% (IQ1) | 8.5% | 11.9% |
| Interquartile 75% (IQ3) | 11.5% | 17.6% |
| Interquartile Range (IQR) | 3.0% | 5.7% |
| Standard Deviation (Sample) | 2.6% | 5.1% |
| Standard Deviation (Population) | 2.6% | 5.0% |
Similar Demographics by Male Disability
Demographics Similar to Guyanese by Male Disability
In terms of male disability, the demographic groups most similar to Guyanese are Immigrants from Grenada (10.5%, a difference of 0.0%), Immigrants from Afghanistan (10.5%, a difference of 0.010%), Jordanian (10.5%, a difference of 0.030%), Colombian (10.5%, a difference of 0.10%), and Ecuadorian (10.5%, a difference of 0.11%).
| Demographics | Rating | Rank | Male Disability |
| Immigrants | Australia | 99.5 /100 | #59 | Exceptional 10.4% |
| Immigrants | Colombia | 99.5 /100 | #60 | Exceptional 10.4% |
| Immigrants | Northern Africa | 99.4 /100 | #61 | Exceptional 10.4% |
| Immigrants | Ecuador | 99.3 /100 | #62 | Exceptional 10.4% |
| Immigrants | Belarus | 99.3 /100 | #63 | Exceptional 10.4% |
| Jordanians | 99.3 /100 | #64 | Exceptional 10.5% |
| Immigrants | Grenada | 99.2 /100 | #65 | Exceptional 10.5% |
| Guyanese | 99.2 /100 | #66 | Exceptional 10.5% |
| Immigrants | Afghanistan | 99.2 /100 | #67 | Exceptional 10.5% |
| Colombians | 99.2 /100 | #68 | Exceptional 10.5% |
| Ecuadorians | 99.2 /100 | #69 | Exceptional 10.5% |
| Immigrants | Bulgaria | 99.1 /100 | #70 | Exceptional 10.5% |
| Immigrants | Cameroon | 99.0 /100 | #71 | Exceptional 10.5% |
| Immigrants | Serbia | 99.0 /100 | #72 | Exceptional 10.5% |
| Immigrants | Lithuania | 98.9 /100 | #73 | Exceptional 10.5% |
Demographics Similar to Immigrants from Micronesia by Male Disability
In terms of male disability, the demographic groups most similar to Immigrants from Micronesia are Nonimmigrants (12.9%, a difference of 0.070%), Marshallese (12.9%, a difference of 0.10%), Inupiat (13.0%, a difference of 0.17%), Yaqui (12.9%, a difference of 0.33%), and Pennsylvania German (13.0%, a difference of 0.37%).
| Demographics | Rating | Rank | Male Disability |
| Yup'ik | 0.0 /100 | #288 | Tragic 12.8% |
| Immigrants | Cabo Verde | 0.0 /100 | #289 | Tragic 12.8% |
| Pima | 0.0 /100 | #290 | Tragic 12.8% |
| Whites/Caucasians | 0.0 /100 | #291 | Tragic 12.8% |
| English | 0.0 /100 | #292 | Tragic 12.8% |
| Yaqui | 0.0 /100 | #293 | Tragic 12.9% |
| Marshallese | 0.0 /100 | #294 | Tragic 12.9% |
| Immigrants | Micronesia | 0.0 /100 | #295 | Tragic 12.9% |
| Immigrants | Nonimmigrants | 0.0 /100 | #296 | Tragic 12.9% |
| Inupiat | 0.0 /100 | #297 | Tragic 13.0% |
| Pennsylvania Germans | 0.0 /100 | #298 | Tragic 13.0% |
| Celtics | 0.0 /100 | #299 | Tragic 13.0% |
| Cheyenne | 0.0 /100 | #300 | Tragic 13.0% |
| French | 0.0 /100 | #301 | Tragic 13.0% |
| Crow | 0.0 /100 | #302 | Tragic 13.1% |