Zip Codes with the Highest Percentage of Population Employed in Legal Services & Support in San Tan Valley, AZ
RELATED REPORTS & OPTIONS
Legal Services & Support
San Tan Valley
Compare Zip Codes
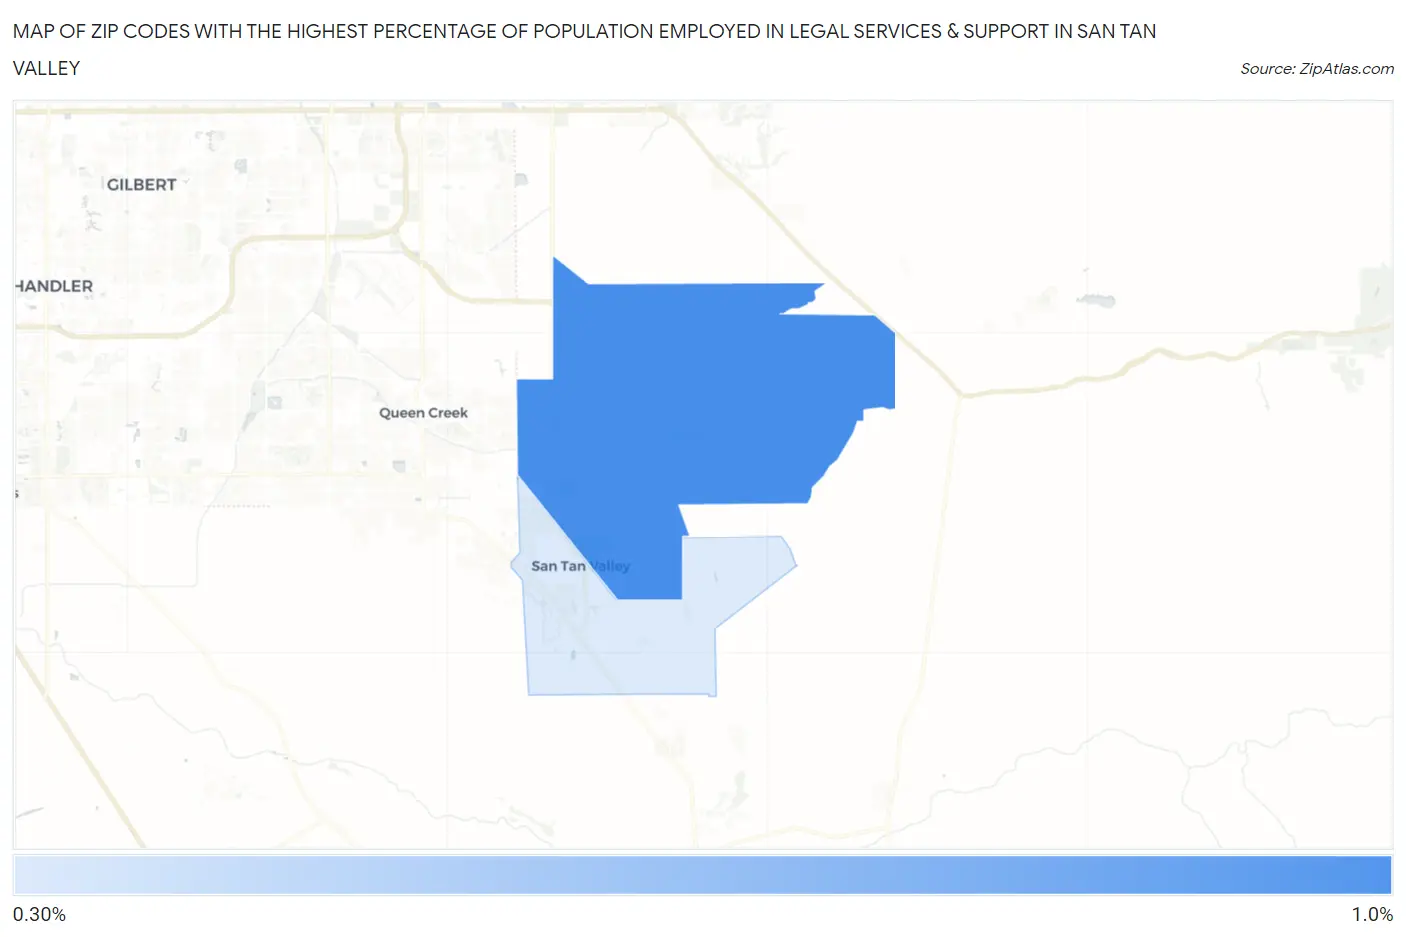
Map of Zip Codes with the Highest Percentage of Population Employed in Legal Services & Support in San Tan Valley
0.35%
0.83%
Zip Codes with the Highest Percentage of Population Employed in Legal Services & Support in San Tan Valley, AZ
| Zip Code | % Employed | vs State | vs National | |
| 1. | 85140 | 0.83% | 0.99%(-0.154)#132 | 1.2%(-0.351)#9,171 |
| 2. | 85143 | 0.35% | 0.99%(-0.633)#206 | 1.2%(-0.831)#14,417 |
1
Common Questions
What are the Top Zip Codes with the Highest Percentage of Population Employed in Legal Services & Support in San Tan Valley, AZ?
Top Zip Codes with the Highest Percentage of Population Employed in Legal Services & Support in San Tan Valley, AZ are:
What zip code has the Highest Percentage of Population Employed in Legal Services & Support in San Tan Valley, AZ?
85140 has the Highest Percentage of Population Employed in Legal Services & Support in San Tan Valley, AZ with 0.83%.
What is the Percentage of Population Employed in Legal Services & Support in San Tan Valley, AZ?
Percentage of Population Employed in Legal Services & Support in San Tan Valley is 0.52%.
What is the Percentage of Population Employed in Legal Services & Support in Arizona?
Percentage of Population Employed in Legal Services & Support in Arizona is 0.99%.
What is the Percentage of Population Employed in Legal Services & Support in the United States?
Percentage of Population Employed in Legal Services & Support in the United States is 1.2%.