Cities with the Highest Percentage of Population with a Degree in Literature and Languages in Ohio
RELATED REPORTS & OPTIONS
Literature and Languages
Ohio
Compare Cities
Map of Cities with the Highest Percentage of Population with a Degree in Literature and Languages in Ohio
0.0%
80.0%
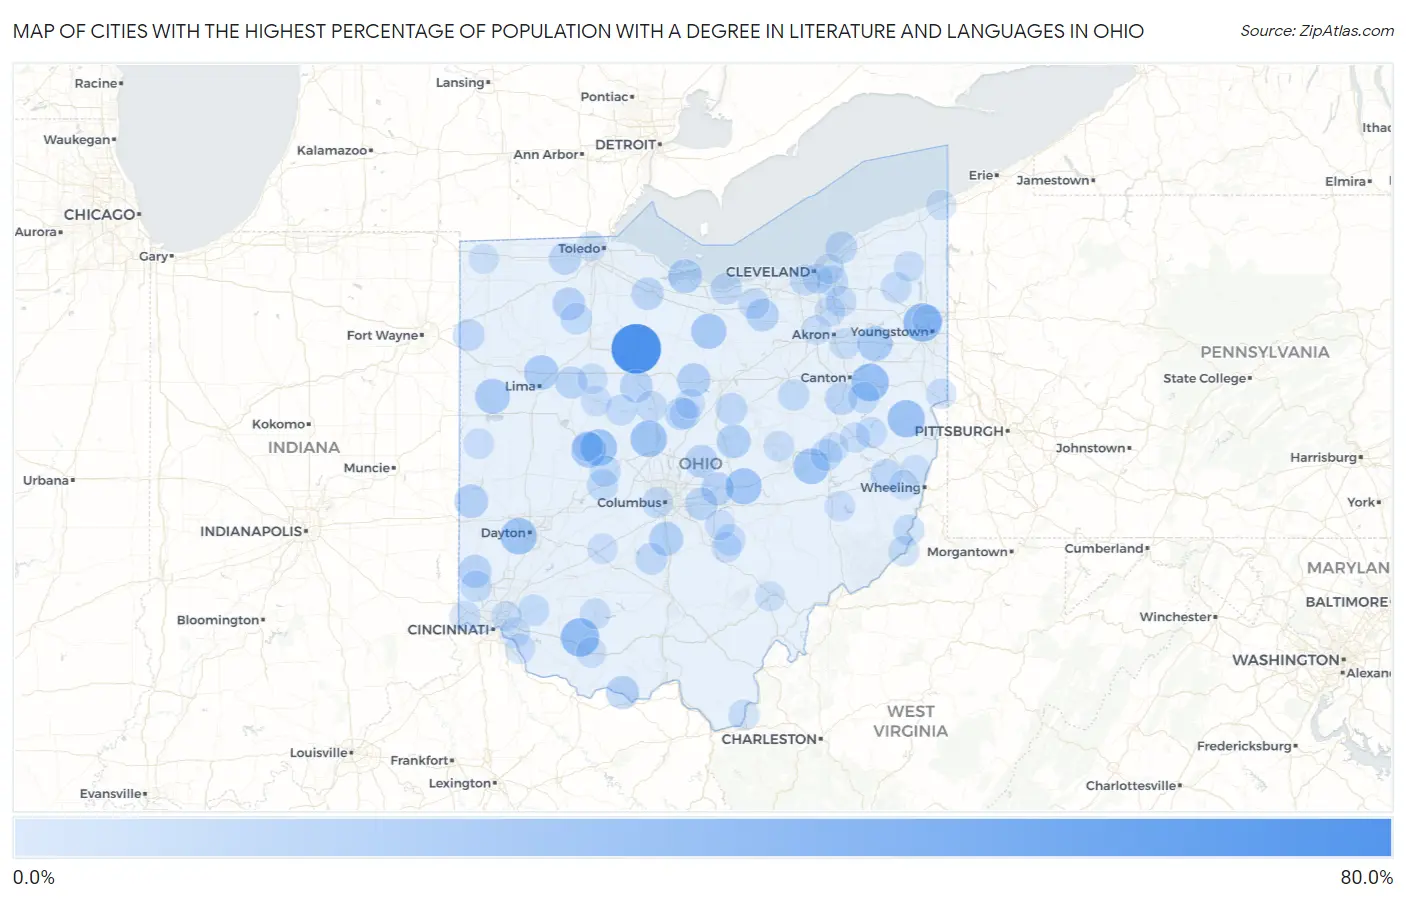
Cities with the Highest Percentage of Population with a Degree in Literature and Languages in Ohio
| City | % Graduates | vs State | vs National | |
| 1. | Mccutchenville | 75.3% | 3.7%(+71.7)#1 | 4.4%(+70.9)#43 |
| 2. | Mowrystown | 36.0% | 3.7%(+32.3)#2 | 4.4%(+31.6)#198 |
| 3. | Hilltop | 35.7% | 3.7%(+32.0)#3 | 4.4%(+31.3)#202 |
| 4. | Robertsville | 33.3% | 3.7%(+29.7)#4 | 4.4%(+28.9)#235 |
| 5. | Bergholz | 31.9% | 3.7%(+28.2)#5 | 4.4%(+27.5)#268 |
| 6. | Radnor | 29.4% | 3.7%(+25.7)#6 | 4.4%(+25.0)#318 |
| 7. | East Liberty | 29.3% | 3.7%(+25.6)#7 | 4.4%(+24.9)#321 |
| 8. | Drexel | 29.1% | 3.7%(+25.4)#8 | 4.4%(+24.7)#323 |
| 9. | Marne | 27.6% | 3.7%(+23.9)#9 | 4.4%(+23.1)#362 |
| 10. | Plainfield | 26.7% | 3.7%(+23.0)#10 | 4.4%(+22.3)#385 |
| 11. | North Fairfield | 25.0% | 3.7%(+21.3)#11 | 4.4%(+20.6)#423 |
| 12. | Valley Hi | 25.0% | 3.7%(+21.3)#12 | 4.4%(+20.6)#435 |
| 13. | Mendon | 23.9% | 3.7%(+20.2)#13 | 4.4%(+19.5)#472 |
| 14. | Atwater | 23.8% | 3.7%(+20.1)#14 | 4.4%(+19.4)#475 |
| 15. | Cairo | 22.6% | 3.7%(+18.9)#15 | 4.4%(+18.2)#517 |
| 16. | Roachester | 21.4% | 3.7%(+17.8)#16 | 4.4%(+17.0)#565 |
| 17. | Bay View | 20.6% | 3.7%(+17.0)#17 | 4.4%(+16.2)#610 |
| 18. | Gambier | 20.6% | 3.7%(+16.9)#18 | 4.4%(+16.2)#611 |
| 19. | South Bloomfield | 20.5% | 3.7%(+16.9)#19 | 4.4%(+16.1)#614 |
| 20. | South Mount Vernon | 20.0% | 3.7%(+16.3)#20 | 4.4%(+15.6)#631 |
| 21. | New Madison | 19.6% | 3.7%(+15.9)#21 | 4.4%(+15.2)#675 |
| 22. | Crestline | 18.8% | 3.7%(+15.1)#22 | 4.4%(+14.4)#720 |
| 23. | Newport Cdp Washington County | 18.2% | 3.7%(+14.5)#23 | 4.4%(+13.8)#769 |
| 24. | Rome Stout | 18.2% | 3.7%(+14.5)#24 | 4.4%(+13.8)#786 |
| 25. | Darrtown | 17.3% | 3.7%(+13.7)#25 | 4.4%(+12.9)#838 |
| 26. | Hartford Croton | 17.2% | 3.7%(+13.6)#26 | 4.4%(+12.8)#845 |
| 27. | Granville South | 17.2% | 3.7%(+13.5)#27 | 4.4%(+12.8)#850 |
| 28. | Pheasant Run | 16.9% | 3.7%(+13.2)#28 | 4.4%(+12.5)#867 |
| 29. | Harpster | 16.7% | 3.7%(+13.0)#29 | 4.4%(+12.3)#896 |
| 30. | Custar | 16.7% | 3.7%(+13.0)#30 | 4.4%(+12.3)#898 |
| 31. | Etna | 16.0% | 3.7%(+12.3)#31 | 4.4%(+11.6)#950 |
| 32. | Edison | 16.0% | 3.7%(+12.3)#32 | 4.4%(+11.6)#951 |
| 33. | Bolivar | 15.9% | 3.7%(+12.2)#33 | 4.4%(+11.5)#960 |
| 34. | Stony Prairie | 15.7% | 3.7%(+12.0)#34 | 4.4%(+11.3)#979 |
| 35. | Swanton | 15.0% | 3.7%(+11.3)#35 | 4.4%(+10.5)#1,067 |
| 36. | Ada | 14.4% | 3.7%(+10.7)#36 | 4.4%(+10.00)#1,124 |
| 37. | Lakeline | 14.0% | 3.7%(+10.4)#37 | 4.4%(+9.63)#1,214 |
| 38. | Sharon Center | 13.8% | 3.7%(+10.1)#38 | 4.4%(+9.41)#1,250 |
| 39. | Flushing | 13.7% | 3.7%(+10.0)#39 | 4.4%(+9.29)#1,276 |
| 40. | Williamsport | 13.7% | 3.7%(+10.0)#40 | 4.4%(+9.27)#1,279 |
| 41. | Payne | 13.6% | 3.7%(+9.96)#41 | 4.4%(+9.23)#1,285 |
| 42. | Butler | 13.4% | 3.7%(+9.76)#42 | 4.4%(+9.02)#1,328 |
| 43. | Newcomerstown | 13.3% | 3.7%(+9.66)#43 | 4.4%(+8.92)#1,335 |
| 44. | Mitiwanga | 13.2% | 3.7%(+9.53)#44 | 4.4%(+8.80)#1,368 |
| 45. | Hoytville | 12.9% | 3.7%(+9.23)#45 | 4.4%(+8.49)#1,407 |
| 46. | Fredericksburg | 12.1% | 3.7%(+8.45)#46 | 4.4%(+7.71)#1,550 |
| 47. | Millville | 12.0% | 3.7%(+8.32)#47 | 4.4%(+7.59)#1,568 |
| 48. | Mechanicsburg | 11.9% | 3.7%(+8.26)#48 | 4.4%(+7.53)#1,577 |
| 49. | North Randall | 11.9% | 3.7%(+8.23)#49 | 4.4%(+7.50)#1,585 |
| 50. | Bowerston | 11.8% | 3.7%(+8.09)#50 | 4.4%(+7.36)#1,617 |
| 51. | Woodstock | 11.8% | 3.7%(+8.09)#51 | 4.4%(+7.36)#1,622 |
| 52. | La Rue | 11.5% | 3.7%(+7.86)#52 | 4.4%(+7.13)#1,663 |
| 53. | Oberlin | 11.4% | 3.7%(+7.70)#53 | 4.4%(+6.97)#1,698 |
| 54. | Waynesburg | 11.4% | 3.7%(+7.69)#54 | 4.4%(+6.95)#1,700 |
| 55. | Bremen | 11.1% | 3.7%(+7.44)#55 | 4.4%(+6.70)#1,759 |
| 56. | Valleyview | 11.1% | 3.7%(+7.44)#56 | 4.4%(+6.70)#1,765 |
| 57. | West Farmington | 11.1% | 3.7%(+7.44)#57 | 4.4%(+6.70)#1,768 |
| 58. | Clarington | 11.1% | 3.7%(+7.44)#58 | 4.4%(+6.70)#1,780 |
| 59. | Linndale | 11.1% | 3.7%(+7.44)#59 | 4.4%(+6.70)#1,782 |
| 60. | Marion | 11.1% | 3.7%(+7.43)#60 | 4.4%(+6.69)#1,799 |
| 61. | Goshen | 11.0% | 3.7%(+7.32)#61 | 4.4%(+6.59)#1,822 |
| 62. | Gomer | 10.9% | 3.7%(+7.19)#62 | 4.4%(+6.46)#1,858 |
| 63. | Hooven | 10.5% | 3.7%(+6.85)#63 | 4.4%(+6.12)#1,965 |
| 64. | Hillsboro | 10.4% | 3.7%(+6.74)#64 | 4.4%(+6.00)#2,008 |
| 65. | Twinsburg Heights | 10.2% | 3.7%(+6.52)#65 | 4.4%(+5.78)#2,084 |
| 66. | Athalia | 10.0% | 3.7%(+6.32)#66 | 4.4%(+5.59)#2,157 |
| 67. | Mount Gilead | 9.9% | 3.7%(+6.18)#67 | 4.4%(+5.44)#2,199 |
| 68. | Lakemore | 9.7% | 3.7%(+6.05)#68 | 4.4%(+5.31)#2,250 |
| 69. | Sardis | 9.6% | 3.7%(+5.91)#69 | 4.4%(+5.18)#2,308 |
| 70. | Burkettsville | 9.5% | 3.7%(+5.85)#70 | 4.4%(+5.11)#2,336 |
| 71. | Peninsula | 9.4% | 3.7%(+5.76)#71 | 4.4%(+5.02)#2,366 |
| 72. | Kenton | 9.4% | 3.7%(+5.72)#72 | 4.4%(+4.98)#2,383 |
| 73. | Bass Lake | 9.4% | 3.7%(+5.70)#73 | 4.4%(+4.97)#2,390 |
| 74. | Cherry Grove | 9.3% | 3.7%(+5.65)#74 | 4.4%(+4.92)#2,407 |
| 75. | Dennison | 9.3% | 3.7%(+5.64)#75 | 4.4%(+4.91)#2,413 |
| 76. | Warsaw | 9.3% | 3.7%(+5.63)#76 | 4.4%(+4.89)#2,424 |
| 77. | Hide A Way Hills | 9.2% | 3.7%(+5.52)#77 | 4.4%(+4.79)#2,478 |
| 78. | Orwell | 9.1% | 3.7%(+5.41)#78 | 4.4%(+4.68)#2,515 |
| 79. | Senecaville | 9.1% | 3.7%(+5.41)#79 | 4.4%(+4.68)#2,526 |
| 80. | Silverton | 9.1% | 3.7%(+5.41)#80 | 4.4%(+4.67)#2,550 |
| 81. | Winchester | 9.0% | 3.7%(+5.35)#81 | 4.4%(+4.62)#2,570 |
| 82. | Jeffersonville | 8.9% | 3.7%(+5.21)#82 | 4.4%(+4.48)#2,652 |
| 83. | Zanesfield | 8.9% | 3.7%(+5.21)#83 | 4.4%(+4.48)#2,658 |
| 84. | Calcutta | 8.9% | 3.7%(+5.20)#84 | 4.4%(+4.47)#2,666 |
| 85. | New Richmond | 8.9% | 3.7%(+5.18)#85 | 4.4%(+4.44)#2,676 |
| 86. | Bidwell | 8.8% | 3.7%(+5.12)#86 | 4.4%(+4.39)#2,693 |
| 87. | Newburgh Heights | 8.6% | 3.7%(+4.96)#87 | 4.4%(+4.23)#2,790 |
| 88. | Dunkirk | 8.5% | 3.7%(+4.83)#88 | 4.4%(+4.10)#2,865 |
| 89. | Pleasantville | 8.5% | 3.7%(+4.83)#89 | 4.4%(+4.10)#2,866 |
| 90. | Conneaut | 8.4% | 3.7%(+4.68)#90 | 4.4%(+3.95)#2,947 |
| 91. | Girard | 8.3% | 3.7%(+4.60)#91 | 4.4%(+3.86)#3,004 |
| 92. | Montpelier | 8.2% | 3.7%(+4.57)#92 | 4.4%(+3.84)#3,021 |
| 93. | Cleveland Heights | 8.2% | 3.7%(+4.54)#93 | 4.4%(+3.80)#3,044 |
| 94. | Ottawa Hills | 8.1% | 3.7%(+4.43)#94 | 4.4%(+3.70)#3,104 |
| 95. | Mount Pleasant | 8.1% | 3.7%(+4.43)#95 | 4.4%(+3.70)#3,115 |
| 96. | Candlewood Lake | 8.1% | 3.7%(+4.38)#96 | 4.4%(+3.65)#3,145 |
| 97. | Port Washington | 8.0% | 3.7%(+4.32)#97 | 4.4%(+3.59)#3,175 |
| 98. | St Clairsville | 7.9% | 3.7%(+4.25)#98 | 4.4%(+3.52)#3,212 |
| 99. | Athens | 7.9% | 3.7%(+4.23)#99 | 4.4%(+3.50)#3,225 |
| 100. | Pigeon Creek | 7.9% | 3.7%(+4.18)#100 | 4.4%(+3.45)#3,256 |
Common Questions
What are the Top 10 Cities with the Highest Percentage of Population with a Degree in Literature and Languages in Ohio?
Top 10 Cities with the Highest Percentage of Population with a Degree in Literature and Languages in Ohio are:
#1
75.3%
#2
36.0%
#3
35.7%
#4
33.3%
#5
31.9%
#6
29.4%
#7
29.3%
#8
29.1%
#9
27.6%
#10
26.7%
What city has the Highest Percentage of Population with a Degree in Literature and Languages in Ohio?
McCutchenville has the Highest Percentage of Population with a Degree in Literature and Languages in Ohio with 75.3%.
What is the Percentage of Population with a Degree in Literature and Languages in the State of Ohio?
Percentage of Population with a Degree in Literature and Languages in Ohio is 3.7%.
What is the Percentage of Population with a Degree in Literature and Languages in the United States?
Percentage of Population with a Degree in Literature and Languages in the United States is 4.4%.